


Bad Debt and Charity Care Reporting
Bad debt expense benchmarks: U.S. acute care hospitals show improvements since 2015
October 2, 2019
4:40 pm
Collecting payments from patients remains a top priority for healthcare providers. But as challenging as these efforts are, they may have become more challenging with the proliferation of high-deductible health plans. These plans have increased the cost burden on patients, which could make it more difficult for hospitals to collect in-full payment.
For this reason, we reviewed trends in bad debt expense reflected in Medicare cost report data, comparing findings of an analysis published in the February 2017 issue of hfm that looked at data from 2015 Medicare cost reports with findings of an analysis that looked at the same type of data listed in 2018 Medicare cost reports.
Not surprisingly, we found bad debt expense reported nationally has increased by $617 million to nearly $56.5 billion between 2015 and 2018. Yet the reason for this increase might well be related more to inflation than to an inability to collect. Further, the data also indicated a decline in bad debt expense as a percentage of revenues over the same period. In other words, proportional to gross charges, less was written off as bad debt expense in 2018 than in 2015.
In the accompanying exhibit, hospitals are categorized into several groups to compare statistics for a variety of operational profiles. The findings account for a variety of facility characteristics, such as whether the hospital is part of a health system, whether it operates a teaching program, and its type of control, number of staffed beds and Medicare policy adjustment program eligibility. Bad debt amounts are divided by gross patient revenue for comparison among groups.
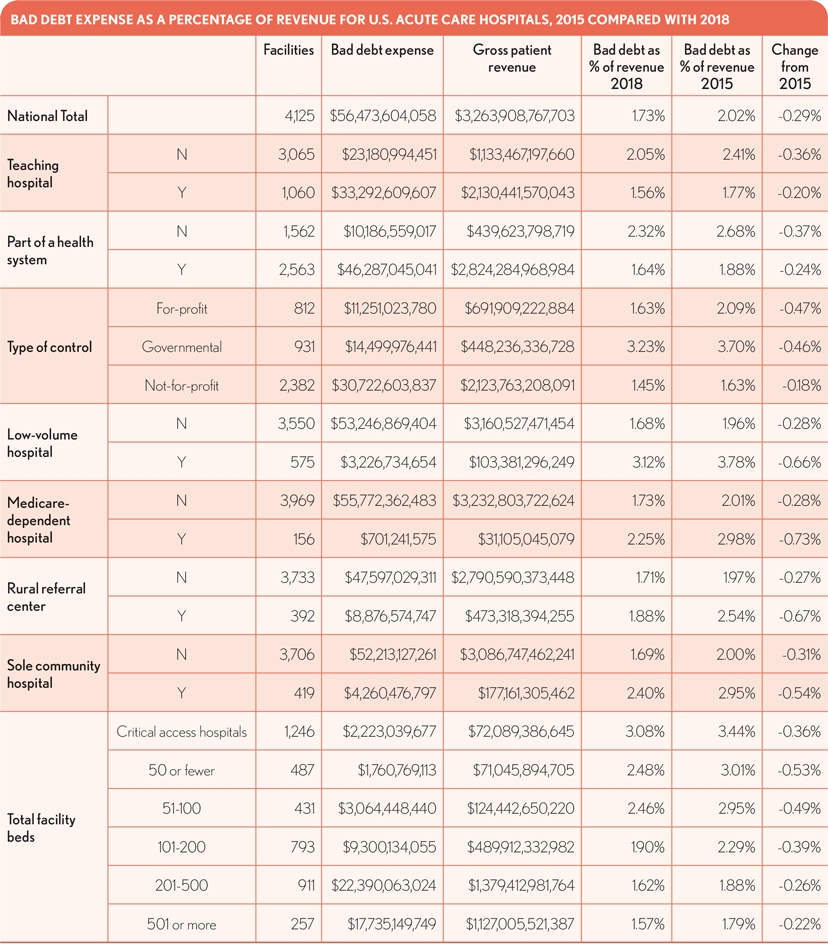
When compared with the 2015 findings, those in 2018 under most classifications still do not stray far from the national average. However, in all categories, bad debt expense as a percentage of revenues has fallen from 2015 through 2018. Smaller facilities, government-controlled entities and those operating as Medicare low- volume hospitals continue to have the highest ratios of bad debt expense as a percentage of revenue. The greatest declines over the four years occurred for Medicare-dependent and low-
volume hospitals and rural referral centers. Not-for-profit and teaching hospitals experienced the smallest percentage changes.
Hospital executives should find these figures useful for examining their own performance on a broad scale and evaluating how well they are managing their own bad debt.
Note: The information analyzed for this study was drawn from all available Medicare cost reports filed for cost-report periods ending during the 2018 calendar year submitted by short-term acute care and critical access hospitals. Specifically, worksheet S-10 collects the amount of bad debts written off for balances owed by patients. This figure represents the entire hospital complex during the reporting period, except for physician and other professional services.