


Analytics

Unleashing the power of healthcare workforce data
April 1, 2021
1:49 am
Sponsored by UKG (Ultimate Kronos Group)
Healthcare organizations today have to carefully balance clinical, operational and financial objectives to ensure they meet patient needs while providing a safe and productive work environment. Effectively managing the healthcare organization’s workforce is key to this comprehensive effort. Not only is labor a hospital’s largest expense, representing around 60% of costs, it is also its largest asset.1 When managed well, organizations can gain efficiencies, improve employee satisfaction, reduce risk and enable high-quality, compliant care.
Unfortunately, hospitals and health systems can struggle to obtain clear visibility into how their workforce functions. Data pertaining to labor is spread across multiple sources and housed in disparate systems that don’t always communicate well with each other. Siloed departments and manual process workarounds can also limit information sharing, causing organizations to miss systemic issues because they don’t have access to the full staffing picture.
This lack of visibility can translate into a more reactive approach to workforce management, which is neither cost effective or especially useful at mitigating risk. In some cases, inefficiencies and inconsistencies may persist because an organization is simply not aware of them. In other cases, the entity may focus on initiatives that deliver a degree of improvement without realizing that there are others that would yield a higher ROI.
Using data and analytics to provide clarity around performance
To help healthcare organizations better understand their workforce, UKG™ (Ultimate Kronos Group) has developed a comprehensive assessment program that leverages real-time data and sophisticated analytics to glean insights about a variety of human capital and workforce challenges that organizations face. Based on these insights, the UKG industry consultant and data scientist team offers actionable strategies that have the potential to yield meaningful financial and operational improvement. UKG is the recently formed company born out of the merger between Kronos Incorporated and Ultimate Software.
“Although other workforce assessments exist, they often use high-level data, which can be out of date and not granular enough to fully appreciate what’s going on in an organization or make improvement actionable,” said Nanne Finis, chief nursing executive for UKG. “Our assessment involves pulling data from the client’s system and looking at the workforce through a different lens. This gives organizations a unique view of staffing and labor, which they have not been able to easily access
to date.”
How does the assessment work?
UKG partners with a healthcare organization to mine, extract and analyze one year’s worth of workforce data from the organization’s existing time and attendance or payroll solution. The UKG team will analyze the data and transform it into operational dashboards that provide clear insights into a company’s performance on several key business value drivers. The healthcare organization receives both summarized and detailed insights that compare the organization’s performance against various benchmarks and identify areas of opportunity to improve productivity while controlling labor costs. Although the data
analytics team primarily focuses on mining the data in UKG’s solutions, they can review information in other vendors’ software as well.
“Fundamentally, we look at how employees are utilized throughout the organization,” said Ralph Baker, senior manager of UKG’s data science practice group, which develops the technical portion of the assessment. “We compare different parts of an organization, viewing the data by department, function and location. As part of the analysis, we search for outliers in terms of inefficiencies, costs, productivity, compliance and so on. By comparing one area to another, we can see which ones are doing a good job of managing various workforce processes, such as the use of overtime. And if an area is not performing as well, we can help the organization get to the root cause of the problem. Is it a training issue? Is it vacancies? Are processes not supporting policy or vice versa? Could technology help?”
Viewing workforce data from a holistic perspective allows an organization to look beyond financial metrics. “Although improving efficiencies and reducing costs are definitely priorities, they are not the only measures on which an organization should be focused,” said Baker. “The strain of the past year has placed a tremendous burden on healthcare workers. So, it’s even more important now that we explore topics like employee fatigue, burnout, turnover and workplace satisfaction because these issues are becoming just as vital as the financial aspects. By digging into some key performance areas in the assessment, we can start to uncover some of these trends that weren’t visible or quantifiable before.”
Workforce assessment value areas
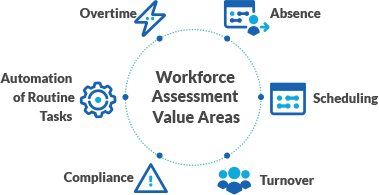
Key areas of focus
To offer a complete picture of the current state of an organization’s workforce, each assessment investigates the following business value areas:
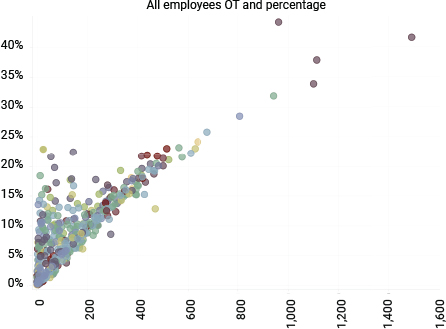
Overtime. This issue represents one of the biggest opportunities for improvement. The assessment prompts organizations to look beyond the overall company average and delve further into the story, zeroing in on concentrations of overtime and outliers that depart from the norm. For example, the chart on the next page shows a portion of one hospital’s overtime assessment, which highlights how a small number of employees was generating a large percentage of the organization’s overtime. In this example, the top 1% of employees accounted for 27,000 hours and $823,000 in overtime, which averaged $16,000 per person. Prior to the assessment, the hospital had no visibility into this high-cost issue.
Unplanned absences. Healthcare organizations frequently see spikes in unplanned absences on certain days, such as Mondays and Fridays or ahead of a holiday weekend. The assessment provides clarity around these trends. Because of the level of detail in the analysis, organizations can identify down to the department and even employee level who is more likely to call out on certain days, and what the financial impacts of those absences are. This allows the entity to schedule staff accordingly, so fewer employees call in sick.
Another issue the analysis may uncover relates to the use of agency staff to fill in for sick days. “In one organization, we discovered that every time somebody called out sick, they picked up the phone and called the nurse staffing agency,” said Doug Hood, workforce business consultant for UKG. “This behavior was quite expensive for the hospital. By switching their processes for covering sick time, and filling shifts with qualified personnel who would not go into overtime, the organization was able to significantly reduce labor costs.”
Turnover. Although there are many aspects of employee turnover to examine, first-year separations present a prime opportunity to decrease costs and discover a potential employee satisfaction issue. When employees leave an organization before completing their first year, the hospital or health system not only has to find a replacement but incur the costs of onboarding and training the individual, which represent a substantial one-time financial outlay. Due to their level of education and expertise, it is particularly expensive when a registered nurse (RN) leaves prior to completing the first year. The chart on the next page shows a portion of a health system’s turnover assessment, revealing how the organization had 438 first-year separations and 106 RN first-year separations. By reducing RN first-year separations by 5%, the organization could see up to $260,000 in cost savings.
Schedule adherence with unused capacity. This part of the assessment reviews the times where an organization pays an RN overtime while another qualified RN who hasn’t worked their full FTE is not scheduled. “A typical scenario is when an employee calls in sick and the manager fills that shift with a person that they know will take the shift,” said Hood. “In these situations, the manager may not realize the overtime ramifications. After seeing the assessment, an organization can identify whether this is happening and use technology solutions to improve scheduling and optimize capacity.”
Compliance information. This part of the analysis highlights metrics like high consecutive days worked, shifts greater than 16 hours, shifts with less than eight hours of rest between them, and whether there are staff members who have high weekly hours over long periods of time. By digging into potential compliance risks, the assessment allows the organization to identify
areas of concern and proactively resolve them.
Automation of routine tasks. Sometimes organizations are steeped in manual processes, which present the opportunity for automation. For example, the assessment measures the volume of manually added punches — where a manager corrects a missed time clock punch by hand — and how those might be adding to organization costs. This seemingly small task can quickly become onerous, hijacking time from front-line supervisors and managers. While manual intervention in this area may be needed, it should have as small a footprint as possible. Organizations may want to consider technology solutions that can streamline this process.
Top overtime earners
Turning insights into action
After the analysis is complete, UKG creates a comprehensive report with top-level findings across the abovementioned categories. “We share this report during an executive presentation, where we discuss possible improvement strategies for each issue,” Hood said. “Depending on the organization, these may involve implementing a new piece of software or optimizing the use of what they already have. We also may suggest creating new policies, offering additional training and so on. Based on the presentation, we can create a roadmap to implement different processes and solutions, identifying ideal places to start that will yield the greatest ROI.”
UKG had one customer that used the assessment as a guide to standardize payroll across the health system. There were more than 20 specific points the organization pulled out of the analysis, and it has instituted policy changes around those areas. “For example, the organization discovered it was using a callback pay code as an incentive for someone to work a double shift when another employee on the unit called off,” said Hood. “However, the callback pay code paid an overtime rate, and there were other qualified personnel who could’ve filled the shift at a lower cost. By changing the policy surrounding the callback code, the organization was able to reduce overtime expenses. In another area, the organization discovered a potential compliance risk because it was not accurately capturing when employees worked through their lunch periods. Again, by recognizing and addressing the issue, the organization was able to reduce risk and also improve employee satisfaction.”
As part of the report, UKG assigns a dollar amount to each issue, demonstrating what the problem is costing the organization based on a reasonable benchmark. This lets the hospital consider the cost of the problem when prioritizing projects.
Laying the foundation for a valuable assessment
To complete a full analysis, UKG requires at least one year’s worth of data. An organization must also identify an executive sponsor to ensure the project is supported. “Whenever you start any strategic project like this, having an executive sponsor who shepherds the process and puts resources behind it is key,” Hood said. “This way it’s not just a meeting where you hear about some interesting trends, but it’s a living, breathing document that can help you achieve meaningful change. If an organization isn’t committed at the senior leadership level, then they won’t get much out of the analysis, and it’s just a wasted effort all around.”
An organization’s commitment to the assessment should not stop with the executive sponsor. A day-to-day sponsor is also essential to help the UKG team get answers to operational questions and facilitate access to the data necessary for the analysis.
“Even more broadly, there must be organizational readiness to accept the results and an appetite to improve,” said Finis. “While the assessment is a complimentary offering to our customers and potential clients, we want to make sure an organization will use the information we provide. As a company, we aim to partner for life with our customers, and this exercise is part of our investment in that relationship.”
Remaining committed to innovation
UKG plans to continue its transformative assessment work going forward. “We just released the UKG data hub,” said Baker. “It’s an analytics platform in the Google Cloud, which will allow us to pursue even deeper analyses and bundle that information with a continuous improvement process. This will be built into our customer success offering, allowing us to revisit the assessments quarterly to gauge progress toward improvement recommendations.”
Turnover and first-year separations
| Today the data shows (in the aggregate) | 5,022 average headcount | 30.9% annualized hire rate | 23.1% annualized termination rate |
| Discovery reveals (the outliers) | 438 first-year-separations | 106 RN first-year separations |
| Value proposal | Savings |
Additional benefits
|
| Reduce RN first-year separations by 5% | $260K | |
| Reduce non-RN first-year separations by 5% | $66K |
About UKG
Propelled by a new tagline, “Our purpose is people,” UKG helps organizations digitize human resources and workforce management practices. By partnering with organizations to offer a data-driven assessment, the company can help hospitals and health systems drive better business outcomes, improve HR effectiveness, streamline the payroll process, and help make work a better, more connected experience for everyone.
This published piece is provided solely for informational purposes. HFMA does not endorse the published material or warrant or guarantee its accuracy. The statements and opinions by participants are those of the participants and not those of HFMA. References to commercial manufacturers, vendors, products, or services that may appear do not constitute endorsements by HFMA.