


Benchmarking and Forecasting
2014-16 Trend Shows Continuing Decline in Self-Pay Admissions to Hospitals
November 28, 2018
11:24 am
A review of data on hospital admissions from 2014 through 2016, the most recent years for which such data are available, points to a continuing decline in the number of beneficiaries admitted to hospitals without healthcare insurance and a subsequent increase in the number of beneficiaries covered by government-sponsored and commercial insurance plans.
Over the study period, the percentage of uninsured admissions (identified in the exhibits as self pay admissions) declined by 13 percent, from about 3 percent in 2014 to about 2.6 percent for 2016. This decrease is significant in that the average charges for an uninsured beneficiary increased 12 percent over the period to more than $38,000 per admission. Moreover, this increase occurred even though the average length of stay (LOS) for an uninsured admission increased only 2 percent, to 4.21 days.
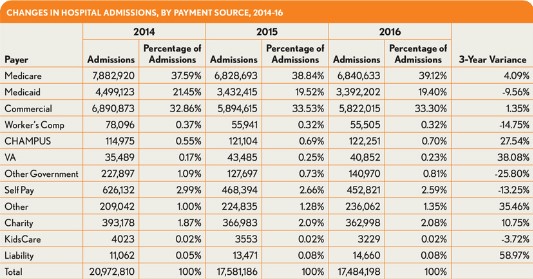
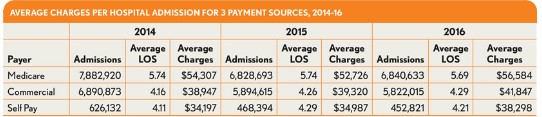
The majority of these uninsured admissions seem to have gone to either traditional Medicare plans or commercial insurance plans, given that each of these payment sources show increases over the period. Medicare admissions show a roughly 4 percent increase from 2014, based primarily on traditional Medicare coverage. Beneficiaries with traditional Medicare fee-for-service coverage accounted for more than 32.4 percent of the total admissions reflected in the available data. compared with 30.7 percent from 2014. A 2.3 percent decrease in Medicare HMO admissions (not shown in the accompanying exhibits) had an impact on the overall Medicare admission numbers, but the impact was not great enough to significantly affect the overall increase in Medicare admissions. Medicare admissions, regardless of being traditional versus HMO for 2016, show an average charge of $56,584, an increase of 4.2 percent over the average charge for 2014.
Commercial admissions show only a 1.35 percent increase, from 32.9 percent in 2014 to 33.3 percent in 2016, while the data show an increase in average charge per admission from $38,947 in 2014 to $41,847 in 2016, representing a 7.4 percent increase. Within the commercial space, traditional commercial plans show a 3.5 percent decrease in admissions during the study period, while HMO and PPO plans show increases of 20 percent and 14 percent, respectively (findings that, again, are not shown in the exhibits). The findings are significant in that the commercial HMO and PPO plans have exhibited increases of 13 percent and 12 percent, respectively, in the average charge per admission over the period. These increases are present even while the average lengths of stay have increased only slightly at rates under 2 percent.
This trend could positively impact hospital financial results, in that the increasing number of “covered” admissions show higher average charges than do those admissions that were previously non-covered and processed as uninsured or self-pay.
Many states collect inpatient admission data from hospitals via a state agency, a hospital trade association, or an outside vendor and, in turn, create and make available non-identifiable data sets for commercial and academic use. The states range from large to small and span the entire length and depth of the country, providing a comprehensive social, ethnic, and geographic base from which comparisons can be made. This analysis draws on the data collected from these states, combined into a single archive of inpatient hospital data for analytic and benchmarking purposes.
This analysis was provided by Optum Payer Solutions consulting. For more information, please contact Jan Welsh.