


Can MRF data be used for comparative benchmarking?
Findings of a recent study underscore why hospital finance leaders should be alert to the limited usefulness for benchmarking of the machine-readable files (MRFs) required under the final rule addressing hospital price transparency.
Published
September 22, 2023
3:34 pm
|
Updated
November 2, 2023
2:35 pm
The impetus for the MRF requirement — as outlined by the U.S. Department of Health & Human Services (HHS) in its 2019 hospital price transparency final rule — was to enable informed decision-making about healthcare services based on their pricing, thereby helping to drive down the cost of healthcare. Yet significant obstacles continue to block the path to realizing this objective.
Obstacles to MRF effectiveness
As noted in the sidebar bat the end of this article (“Rule-making seeks to address MRF shortcomings”), HHS has acknowledged limitations in the usefulness of MRFs because of differences in data elements among files currently being developed. Simply put, hospitals should exercise caution in using these files for comparative benchmarking because the current MRF requirements fail to address two essential elements: a standardized methodology field and standard payer and plan naming convention. A 2023 study, conducted by Panacea Healthcare Solutions, LLC, examined how the lack of these two elements undermines the comparability of providers’ MRFs.
1 Standardized methodology field. Currently, with respect to any of hundreds if not thousands of HCPCS codes, a provider could have an all-inclusive or bundled negotiated case rate for the single line item. Yet other providers may instead have negotiated a per-visit rate that includes the reimbursable costs for all services except those revenue codes or areas covered by separate fee schedules. And still other hospitals may simply have negotiated a percentage of charge method to be used.
Under these circumstances, MRF users may unknowingly be comparing rates of hospitals being paid under different methodologies, leading them to draw false conclusions about which hospitals’ rates are higher or lower. Many public advocacy groups and media outlets that are already publishing their opinions regarding published MRF data are likely drawing conclusions based on data that does not yet reflect the standardization that CMS acknowledged in its 2019 final rule is needed.
To assess the magnitude of the issue, Panacea’s study used payer contract data from a sample of 175 hospitals across the nation, where 20% of hospitals are teaching facilities, 35% are hospitals over 200 beds and 90% of hospitals are short-term acute care versus specialty-based hospitals.
The study found that for HCPCS code 99282 ‒ ED visit, only 4% of rates were per-visit rates, with negotiated rates averaging $1,593. By contrast, 73% represented per unit (line-item only) negotiated rates averaging $820, and 23% represented case rates averaging $4,651.
Percentage distribution of negotiated rate methodologies, CPT 99282 ‒ ED visit

Thus, to avoid a false conclusion, one must understand that the almost 500% difference between the highest and lowest average rates is due to the fact that one rate includes all ancillary services while the other rate does not.
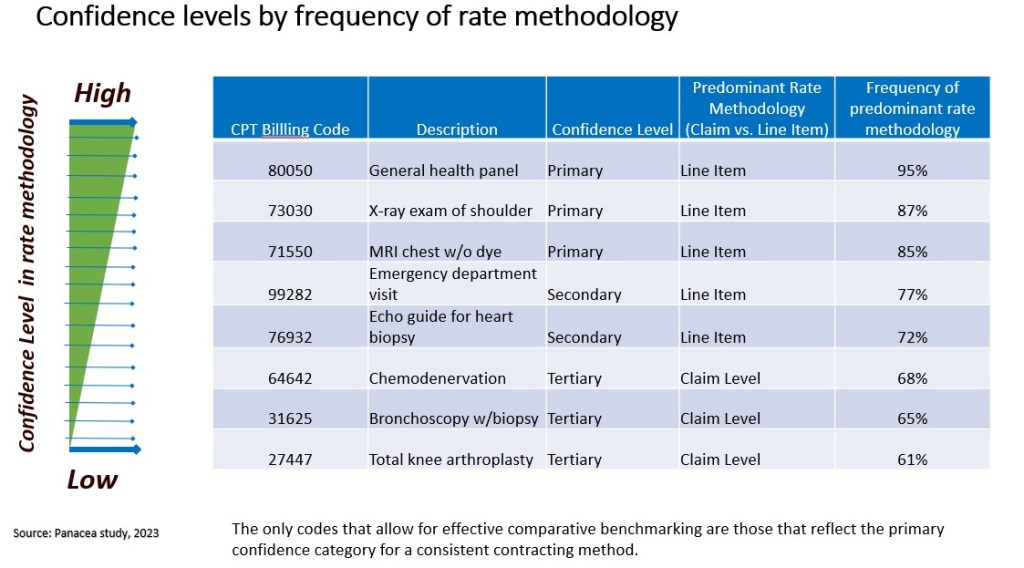
Further, in reviewing the payer contracts from the 175 hospitals, the study was able to classify HCPCS codes into primary, secondary and tertiary confidence categories based on the extent to which one contracting method for the code is predominant among all providers. And only with codes in the primary category is the contracting method sufficiently predominant to allow for reliable comparative benchmarking.
For example, lab and radiology diagnostic services have a high confidence level for a consistent contracting method, with an over 80% likelihood of being paid on a line-item basis, while surgical services are less likely to have a consistent contracting method across payers and therefore are less conducive for comparative benchmarking.
2 Standardized payer and plan naming convention. CMS does not currently require hospitals to map their unique and disparate payer descriptions to a standardized payer plan, making it problematic to accurately compare, for example, Blue Cross PPO billing rates between two hospitals. The Panacea study found that among Blue Cross contracts alone, 400 different contract naming conventions were identified for all product types that meet the criteria of being PPOs.
For more meaningfully comparison of negotiated rates across payers, Panacea cleansed the data, consolidating up to 10,000 disparate contract names in more than 500 raw MRFs into a handful of standard plan or product categories, such as PPO, HMO, Medicare Advantage and Medicaid Advantage. To validate the importance of this exercise, the study sampled over 500 MRFs with standard payer and product types to compare average negotiated rates across the nation and at the state level for several common diagnostic services.
The study found, for example, that the average negotiated rate in Texas for CPT 70450 ‒ CT Head/Brain w/o Dye at United HealthCare varies significantly across each product type, with PPO being the highest, at an average negotiated rate of about $1,186, and Medicare Advantage being the lowest, at an average of $271 (as shown in the exhibit below).
Average negotiated rates by product type, United Healthcare: CPT 70450 — CT Head/Brain w/o Dye

These results make it clear that before attempting to use MRF data to compare negotiated rates across a single payer or multiple payers, hospital finance leaders should first standardize the product type for each contract name to avoid apples-to-oranges comparisons.
A similar analysis examining the same service and reviewing negotiated rates for only the PPO product type across different payers found less variation and provided more apples-to-apples comparisons (see the exhibit below).
Average negotiated rates by product type, PPO: CPT 70450 — CT Head/Brain w/o Dye

In both analyses, there is noticeable variation between national and state negotiated rate averages and general consistency regarding payers or product types that have the highest negotiated rate. For example, PPOs have the highest negotiated rate at the product level and Cigna has the highest rates among payers both in Texas and among national averages. These findings underscore the importance of classifying the plan or product type into a standard category and accounting for geographical considerations when selecting a peer group for comparative analysis.
How can MRF data be made more useful?
To be able to perform meaningful comparative benchmarking using these negotiating rates, it is first necessary to translate the disparate payer plan names to a few standardized names across entities and identify the codes with highly predominant methodologies. Then, to further improve the integrity of the benchmarking data, any remaining outlier negotiated rates (perhaps those few with different methodologies) should be screened out, which can be done by applying a traditional 1 or 2 standard deviation calculation to the data on a code-by-code basis.
Even after these steps, however, there still may be significant variation in negotiated rates for the same service.
The exhibit below, for example, demonstrates how negotiated rates for a common lab test can vary significantly across hospitals even within the same regional peer group and payer/product type. The mean negotiated rate for the seven-hospital peer group analysis of urban academic medical centers within the state of Texas is $137. Hospital C shows the lowest negotiated rate at $90, or 34% below the peer group mean, and Hospital F with the highest negotiated rate at $216, or 58% above the peer group mean.
Meaningful variation in rates within a peer group of Texas academic medical centers, for a PPO product type

can vary significantly across hospitals even within the same regional peer group and payer/product type.
This type of analysis is most impactful in enabling hospitals to understand their negotiated rate position in the market and pinpoint opportunities for improved negotiated rates. Hospital leaders should perform such analyses for all service lines so they can incorporate the findings into negotiations with payers to justify higher payment rates.
Takeaways for future action
The findings of Panacea’s study regarding provider MRFs point to two important conclusions:
- Improved provider compliance is needed for all healthcare constituents to benefit.
- CMS should move forward with requiring that each provider’s MRF include the contracting method and incorporate standardized payer and plan types.
The study also found that while payer MRFs can be useful for comparative purposes, they present their own set of challenges (which are addressed in the sidebar below, “Payer MRFs and hospital MRFs: Which are more useful?”).
Use of the current negotiated rate data requires great caution, but as long as proper data integrity analytics are applied, comparative rate analysis is feasible and can be highly beneficial. With the new requirements and increased enforcement by CMS, the integrity of future negotiated rate data for comparative benchmarking will be improved.
Payer MRFs and hospital MRFs: Which are more useful?
Under CMS’s Transparency in Coverage (TiC) rule, which went into effect on July 1, 2022, most health insurers and group health plans are required to disclose on a public website their in-network negotiated rates and allowed amounts paid for out-of-network providers. Compliance with posting MRFs thus far has generally been higher among payers than among hospitals because the financial penalties for payer noncompliance are stringent, and CMS makes resources such as technology implementation guides and schemas available to them via GitHub (github.com/CMSgov/price-transparency-guide).
Possible advantages of payer MRFs
The market perception is that the additional fields required in payer MRFs makes them more useful than hospital MRFs, such as the negotiated arrangement and negotiated type, as shown in the exhibit below. These standard fields may allow for apples-to-apples comparisons of rates without the risk inherent in a hospital MRF as described in the above article. The payer MRFs are also updated monthly with the expiration date listed for each negotiated rate with a provider.

Limitations of payer MRFs
A problem with payer MRFs is that they exclude important negotiated rate information that hospital MRFs include. For example, if a payer is reimbursing a provider on a percentage of charge basis, then only the percentage and not the actual dollar amount is disclosed on the payer MRF. The standard gross charge or billed charges is not a required field in payer MRFs, making it necessary to access to the hospital MRF to calculate the negotiated dollar amount before a comparative analysis can be performed. Unfortunately, payer MRFs also exclude the negotiated rates for Medicare and Medicaid advantage plans, unlike hospital MRFs, which are required to include such rates.
Among the most significant challenges with payer MRFs is in the effort to aggregate and normalize the huge amount of negotiated rate data and files into a single database. A single payer can have more than 100,000 files with billions of negotiated rates, which can easily add up to a terabyte of data. Adding to the complexity of the files, some payers organize negotiated rates in their MRFs by employer group, making it difficult to compare negotiated rates that are within the same plan or product type level.