


Analytics
From Disparate Data to Informed Strategies: Using Technology to Transform Quality, Costs, and the Patient Experience
February 5, 2018
3:31 pm
A healthcare organization’s ability to sustain high-value care delivery and ensure its long-term financial viability is increasingly dependent on how effectively it can apply data analytics to inform improvement efforts related to quality, cost, and patient experience.
The mandate is clear. Independent of policy shifts in Washington, the demands for greater healthcare value will not subside. In response, proactive leadership teams in hospitals and other organizations are working hard to improve care quality and the patient experience, while lowering costs.
Business technology that combines clinical and financial information plays a leading role in performance improvement in the changing payment environment. Payer demands for value will accelerate through both volume- and value-based mechanisms that vary significantly by market and segment. As the mix of payment and care delivery models evolve, hospitals will need to know specifically how well they are managing populations and gaining volumes at the service level. a Accountability for value is increasingly expected in both inpatient and clinic settings.
Through amalgamation of disparate data sources that can inform strategies, cloud-enabled analytics and reporting underpin an organization’s ability to achieve and sustain high-value care delivery, and are critical elements of the cost of business. Using such tools, hospital and health system managers and clinicians can assess clinical and financial performance to develop, execute, and monitor strategies that will drive the required healthcare change. Interoperability of data and analytics will facilitate enterprisewide reporting across inpatient and ambulatory settings.
Current Realities and Future Imperatives
To improve strategic decision making, most organizations would benefit from making more effective use of data and analytics. Among respondents to a recent survey of healthcare CFOs and other senior finance executives: b
- Only 15 percent say that their organizations are “very prepared” to manage evolving payment and delivery models with current processes and tools
- About 90 percent believe their organizations should be doing more to leverage financial and operational data to inform strategic decisions
- More than 50 percent want access to trusted data and better dashboards and visuals
Accountability for using data to inform strategic decision-making exists at all levels in an organization. The type of data used—whether specific to the system, hospital, service line, department, unit, physician, or patient encounter—and how those data are displayed can be specific to the “chain of accountability” that links patients, clinicians, managers, directors, executives, and trustees.
The best way to engage these individuals is to begin by holding them accountable for their impact on patient lives, as measured by functional status, morbidity and mortality, patient/family experience, and cost, and to then report on progress using appropriate dashboards and other visuals.
For example, trustees and the C-suite, who are responsible for approving and overseeing the pursuit of improvement opportunities, can best view progress in a way that aids their decision making by using executive summaries and dashboards. Meanwhile, the directors and managers who design and redesign processes within operations and the providers who implement those processes can track their progress through dashboards and statistical process control charts. The key characteristic of a consummate reporting process is transparency from system level to patient level, covering quality, outcomes, cost, and patient experience.
A health system’s current business technology typically includes numerous proprietary databases for specific financial and clinical functions. Patient data come from many different source systems, such as electronic health records (EHRs) used by hospitals and physician groups, evidence-based order sets, diagnostic results, and patient satisfaction scores. Financial data come from sources such as billing/accounting systems, general ledgers, charge masters, supply chain systems, and payroll and attendance systems. Clinical data come from EHRs, core measures, registries, and others. Many of the databases covering patient, financial, and clinical information used by hospitals and clinics were formed to meet state and regulatory reporting requirements and may have been home-grown or purchased. An organization’s disparate collection of business technology can make it difficult to integrate clinical and financial data.
The Input-to-Output Process
That situation is changing. Data management has evolved to the point where hospitals and health systems now can combine many different financial and clinical data in a way that builds reporting credibility and transparency and ensures that the organization’s chief medical and nursing officers, CFO, COO, and other leaders and managers are speaking the same language and reviewing the same reports.
An effective data management system has four core functions:
- To integrate data from disparate systems to allow performance measurement
- To calculate metrics that generally follow discipline-specific, transparency-based definitions
- To define benchmarks of relevant peer groups
- To develop analytics that are monitored over time to pinpoint improvement opportunities
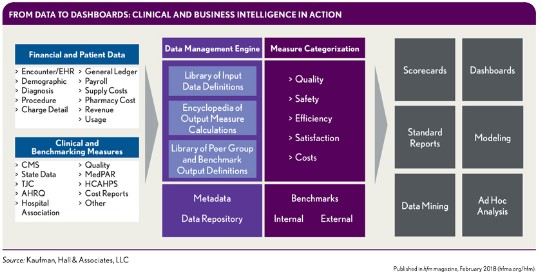
The exhibit at left illustrates the inputs, operating components, and outputs of a clinical and business system that effectively performs these four functions.
With inputs coming from dozens of sources (far left in the above exhibit), including internal financial and patient encounter data and external clinical and benchmarking measures, the data management engine normalizes the data, links all data sources to the patient, applies severity and risk adjustment, and integrates benchmarks. Moreover, hospitals and health systems can easily implement such a measure-centric system within current business processes and conduct their own analyses.
Key elements of such a system, as shown in the exhibit, are the following data components:
- Library of input data definitions
- Encyclopedia of output measure calculations
- Library of peer group and benchmark output definitions
Library of input data definitions. This component ingests data from hospital source application systems (e.g., EHR, general ledger) and parses the data formats and elements to meet system specifications or adds new formats. In this way, data from disparate commercial and home-grown systems are normalized to a single analytical platform that is measure-centric.
Encyclopedia of output measure calculations. Within this component, measure content is calculated, categorized into five areas (quality, safety, efficiency, satisfaction, and costs), and added to streamline analytics and make them user-friendly. Examples of measure content include data elements such as hospital-acquired conditions (HACs).
Third-party software also can be used to add content that is meaningful to analytics—for example, the 3M™ All Patient Refined DRG (APR DRG)Classification System. By tagging measures at the encounter level, the system can allow users to aggregate the data at any level—for example, by system, facility, service line, nurse unit, physician group, physician, and clinical condition.
Library of peer group and benchmark output definitions. The function of this component is to create benchmarks from the data, whether external (e.g., publicly available files), internal to a health system (i.e., comparing hospitals within the health system), or internal to a hospital (e.g., comparing one physician’s performance with that of a group of peers). This component also should include all files from the Centers for Medicare & Medicaid Services (CMS), for use in benchmarking performance by quartile—an important capability, given that CMS penalizes and pays for performance based on quartile results. National benchmarks are the targets organizations typically strive to achieve or surpass, and the basis of national awards.
After data scrubbing and tagging with value-added benchmarks, all the data are housed in a data repository to be drawn upon for analysis, performance evaluation, and reporting on five measures—quality, safety, efficiency, satisfaction, and costs. Data can be risk- and severity-adjusted and mined and modeled for further detail and ad hoc analyses, and it can be used to create standard and custom reports, scorecards, and dashboards.
Informing Strategies
With such an integrated business and clinical tool, users can access one source of credible data, rather than consulting dozens of different portals to understand the breadth of a care delivery issue. c The end result of such a system is the ability to make better decisions about strategies that will improve quality, outcomes, cost, and the patient experience. Four examples of the powerful use of data and analytics to do so follow.
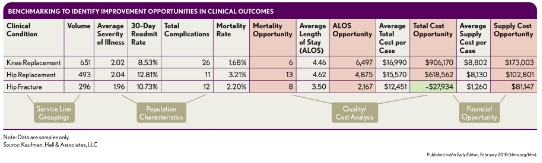
Performance analysis by condition or service line. Identification of cost and quality improvement opportunities with high-volume, high-cost clinical conditions is one place organizations can start their data mining, modeling, and analytics. The following exhibit is a dashboard with organizational data on three typically high-cost high-volume conditions in an orthopedic service line: knee replacement, hip replacement, and hip fracture. Lowering costs while improving outcomes is a goal for this organization.
The organization’s measures with respect to orthopedic outcomes (mortality and average length of stay) and costs (average cost per case and average supply cost per case) for the three conditions are compared with those of a regional all-payer peer group to identify “opportunities,” shown in red and green. The red boxes indicate where the organization could achieve savings, and the green boxes indicate where performance exceeds benchmarks. External peer group comparisons like this one can help assess performance across geographic regions, which could inform decision making about program direction in any one health system.
For example, compared with a regional peer group, this health system has high mortality rates and above-average lengths of stay (LOS). Reducing LOS to the peer group average yields a LOS opportunity of nearly 6,500 days across the 651 knee replacements performed by the system, or one fewer day per patient. The total opportunity related to cost reductions with knee replacements is more than $900,000, with $173,000 of this coming from lower supply costs. If this organization wishes to be a center of excellence or a health plan’s provider of choice for joint replacement, for example, benchmarking indicates the level of needed improvement.
Analysis focused on reducing clinical variation. For most hospitals and health systems, unwarranted variation in care practices is strongly associated with suboptimal patient outcomes and unnecessarily high costs.
By studying variation among care practices and practitioners, processes, supplies, and technologies, interdisciplinary improvement teams can identify opportunities for improved patient safety and quality that also will reduce surgical and related hospital costs. Better patient outcomes can be achieved through the following:
- Specific improvement targets that include attainable and measurable goals established using benchmark data
- Well-mapped and streamlined processes
- Application of evidence-based change strategies
Improvement efforts can be accelerated by fostering a willingness among physicians to examine their performance looking at measures of unwarranted variation, and by holding the physicians accountable for adopting standardized, evidence-based care practices. Physicians who are presented with trustworthy data on how their non-evidence-based practices yield suboptimal results typically will quickly bring their practices in line with the evidence-based practices used by peers.
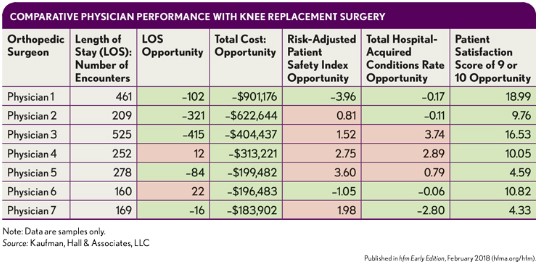
With the approach shown in the previous exhibit, the next step is to drill down to the individual physician level to identify opportunities to reduce unwarranted variation in knee replacements. The exhibit that follows provides an example of how one organization initiated such discussions with physicians using severity-adjusted, validated, and reliable data from multiple sources. The exhibit compares performance of seven physicians, highlighting that Physician 1 performed above the national all-payer benchmark for short-term, acute care facilities nationwide. Performance dimensions include LOS, total cost, a risk-adjusted patient safety index including pressure ulcer rates and post-operative infections, the HAC rate, and a patient satisfaction rating.
In-depth evaluation of physician practice. The exhibit below shows a section of a sample evaluation report for the combined inpatient and outpatient practice of an individual physician. Provided on a regular basis, this report enables the physician to monitor improvement and maintain gains and accountability toward quality, cost, outcomes, and patient experience goals. As identified in the areas highlighted with red, Dr. Randall has opportunities to reduce LOS in critical care and ICU units as well as to reduce total costs, including pharmacy costs in particular. He performs better than benchmarks in the areas highlighted in green.
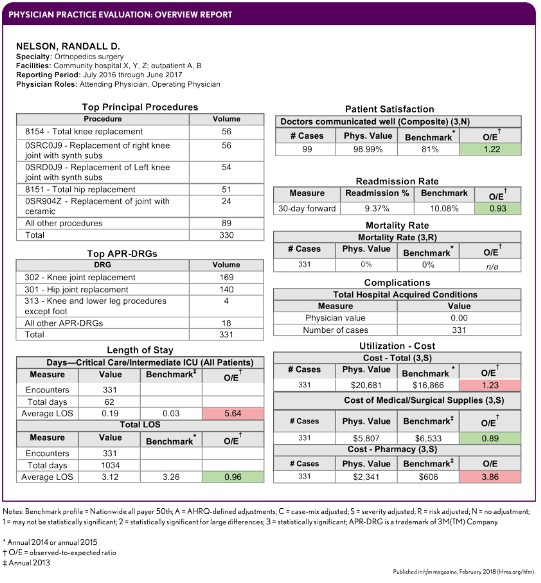
Reports can be configured with different measures and benchmarks to meet specific needs of physician specialties and service lines. A rich database includes data on payer mix, principal procedures, readmissions, identified consultants, physician roles, and other information. Using technology, an organization can automatically push reports to physicians and physician groups for annotated comments and signatures to support accountability for performance and improvement. Physicians also can be equipped with interactive dashboards to drill into their own data and assess sources and timing of variation.
Improved end-of-life care. End-of-life care in the United States is in many ways deficient. Despite broad recognition that more care isn’t necessarily better care, many patients receive aggressive medical interventions in hospitals in their final months and days of life. d Spending on Medicare beneficiaries in the last year of life accounts for about 25 percent of total Medicare spending—a proportion that has persisted for decades. e Hospitals must play a major role in moving to a new approach that involves providing gentler, more realistic services cost-effectively.
Every hospital and health system should consider using data- and analytics-enhanced decision making about end-of-life care. The large baby boomer population has now reached age 53 to 71. Healthcare executives should get their arms around data related to the end-of-life care delivered in their hospitals, because where the care is provided to current and future generations—whether in an ICU unit, a general acute unit, or home hospice—will make a significant difference in determining the level of the patient experience, care quality, and costs.
EHR and billing data should be accessed and combined to identify patients with the following circumstances:
- Patients who died in ICUs
- Patients who died with do-not-resuscitate (DNS) orders
- Patients who received a palliative care consultation
- Patients whose preferences for end-of-life care are identified in EHRs
- Patients who were discharged to home hospice or facility-based hospice
Questions to ask include:
- Are end-of-life patient preferences being honored in the acute care environment, and if not, why not?
- Is care provided in ICUs managed with palliative care and hospice principles?
- Are patients with DNRs dying in lowest-possible care-intensity settings?
Point of care is a major issue. The goal is to get patients out of ICUs and into a more comfortable and supportive milieu for them and their families—ideally back in their homes if their care can be managed there, and if not, into hospice facilities. Regular reports like that shown in the exhibit below can be built to track end-of-life outcomes and costs at the point of care.
A Basis for High-Value Care
Data, analytics, and reporting are foundational to an organization’s provision of high-value health care. Integration of disparate business and clinical data create the “one source of truth” that is key to high-quality strategic decision making, whether about physician practice, service line performance, hospital-level performance, or end-of-life care. The critical charge for healthcare finance leaders going forward is to ensure that their organizations are equipped to make well-informed and sound decisions based on a comprehensive system for data analytics.
Footnotes
a. O’Riordan, J., “Payer and Delivery Strategies in an Uncertain Environment,” Presentation at 2017 Healthcare Leadership Conference, Chicago, Oct. 19, 2017.
b. Kaufman, Hall & Associates, 2018 CFO Outlook: Performance Management Trends and Priorities in Healthcare, Skokie, 2018.
c. Kaufman, Hall & Associates, LLC, SCL Health Uses Data and Analytics from Total Benchmark Solution™ to Improve Clinical and Financial Performance , case study, Fall 2016.
d. Grube, M., “ A Responsibility to Improve End-of-Life Care,” Kaufman Hall Blog, Nov. 2, 2017.
e. Henry J. Kaiser Family Foundation, “ 10 FAQs: Medicare’s Role in End-of-Life Care,” fact sheet, Sept. 26, 2016.
The authors would like to thank Amy Raasch, solutions engineer at Kaufman, Hall & Associates, for her expert assistance with the data and graphics for this article.