The Medicare Cost Report collects a great deal of information pertaining to the cost of operations for acute care hospitals. Worksheet A contains a section to gather general service costs incurred in the operation of a facility that are not directly associated with furnishing patient care, such as mortgage, rent, and plant operations. Reviewing these costs in a historical analysis can reveal patterns in operations among different classifications of providers and trends over time.
For this analysis, the focus was on line 1, column 2 of Worksheet A, which aggregates capital-related costs for buildings and fixtures. The Cost Report instructions note that “capital costs are defined as all allowable capital-related costs for land and depreciable assets, with additional recognition of costs for capital-related items and services” and that these costs include “depreciation, leases, and rentals for the use of facilities and/or equipment, and interest incurred in acquiring land or depreciable assets used for patient care.”
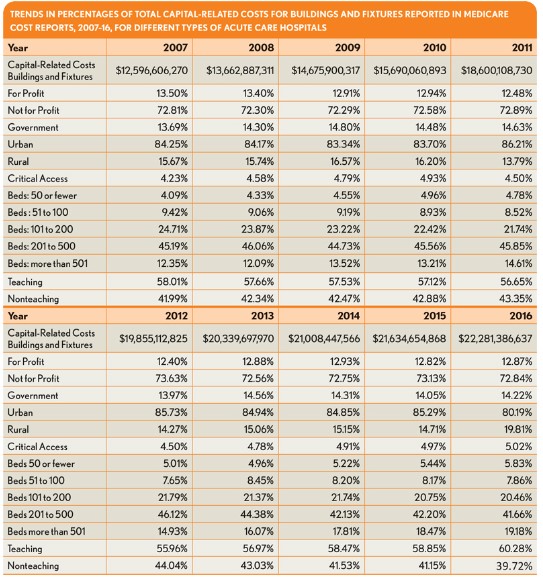
Data for all available short-term acute care and critical access hospitals were summarized for Cost Reports with periods ending during the 2007 to 2016 calendar years. Data were then grouped into classifications based on four operational characteristics for each calendar year. The exhibit opposite shows total capital building and fixture costs for each calendar year for all hospitals along with a breakdown for each operational characteristic category. For each category, the percentage of total capital building and fixture costs associated with that group are shown.
For most categories, the cost percentages are relatively consistent during the periods studied; the total costs show an increase from $12 billion to more than $22 billion. One remarkable trend is the shift in the share of costs from 12 percent to 19 percent for larger hospitals with more than 500 beds, whereas midsized hospitals (101 to 500 beds) saw their costs decline. Also of note is the rise in the capital building and fixture cost percentage among rural providers in 2016.
Unfortunately, based on these data alone, it is difficult to draw conclusions regarding why these changes occurred. However, industry executives, operators and consultants may find the analysis useful for better understanding how capital has been consumed to differing degrees among acute care hospital types in recent years.

This analysis was performed by American Hospital Directory, Inc., Louisville, Ky. For more information, contact William Shoemaker.


