


Healthcare Business Trends
Key questions for providers after more than 2 years of the price transparency rule
Evidence amassed from over two years of experience with compliance reinforces why providers need to focus on chargemaster prices and self-pay discount policies — and how they can benefit from analyzing trends in consumers’ price searches.
August 25, 2023
5:31 pm
Effective Jan. 1, 2021, under CMS’s final outpatient prospective payment system (OPPS) final rule for CY2020, hospitals nationwide were required to publish their negotiated rates, chargemaster prices and drug prices for all items and services in a machine-readable file (MRF) and generate a more user-friendly consumer display showing pricing information for 300 shoppable items and services.a
Compliance among U.S. hospitals overall proved less than stellar. One study found that fewer than half of hospitals even attempted to comply with the requirements.
Nonetheless, by January 2022, compliant MRFs were available for more than 1,000 hospitals, with about twice that compliance level for consumer displays. Moreover, with penalties having been increased 20-fold in 2022, and with more aggressive actions by CMS having been announced for 2024, it is reasonable to expect that more than 90% of providers will be fully compliant within the year.
Despite the delays in enforcement and expansion of CMS requirements, many hospitals currently enjoy the advantage of having two complete years of experience with meeting price transparency requirements. And they can glean from that experience factual information regarding the following key questions.
1 Are consumers using price estimation systems?
Before CMS published its original final price transparency rule, many providers and payers have questioned the extent to which consumers would use a consumer display or patient estimation system.
The answer to this question seems moot, however. In an era when consumers can search and compare prices for hotels, airfare, cars and just about all retail products and services, it seems inevitable that consumers will also shop healthcare rates and prices once they become aware that they can do so.
A study conducted by Panacea Healthcare Solutions in 2022 sought to assess consumer use of hospital price estimation systems. The study’s sample comprised 50 providers ranging from 25 beds to over 350 beds (including a good representation of teaching and non-teaching hospitals and specialty providers) from more than a dozen states. The results revealed that, in the second year since the rule’s implementation, among all hospitals, only nine estimates were provided monthly, on average. But among hospitals larger than 120 beds, the number of estimates averaged 40 per month, with a high of 65 per month. Consumer online sessions also were found to trend upward over time, as depicted in the exhibit below.
Rise in patient price estimates, February-October 2022
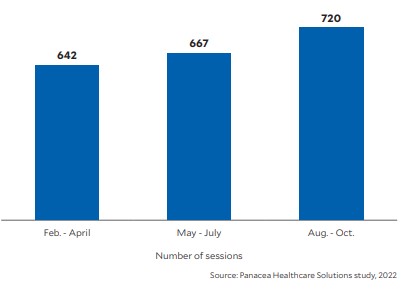
Based on a 50-hospital sample, measured in consecutive three-month periods, the number of patient price estimation sessions increased by about 4% from February-April through May-July 2022 and by about 8% from May-July through August-October 2022, for a total increase over that time of about 12%/
Based on a 50-hospital sample, measured in consecutive three-month periods, the number of patient price estimation sessions increased by about 4% from February-April through May-July 2022 and by about 8% from May-July through August-October 2022, for a total increase over that time of about 12%.
These findings support the premise that providers can expect to see increases in price estimates as public awareness grows and as the elective admissions and shoppable admissions return to normal in this period after the pandemic. Assuming trends continue, providers nationwide that are compliant with the price transparency rule could find themselves furnishing as many as 100 to 300 estimates per month, on average, by the end of 2023, depending on hospital size.
In fact, recent Panacea research following the 2022 study disclosed that the monthly average from November 2022 through May 2023 increased from nine to 15 estimates per month for smaller hospitals, and from 65 to 76 estimates per month for larger hospitals.
2 What type of estimates do consumers seek?
For the 50 hospitals sampled in the 2022 study, the exhibit below lists the top-10 services consumers shopped for over the nine-month period, with the average number of pricing requests among all the hospitals.
Ranking of top-10 procedures in terms of consumer requests for price estimates, February-October 2022
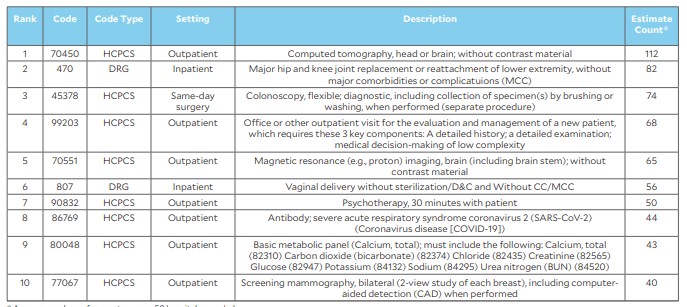
The list shows that among the procedures for which patients most-often requested price estimates, the top inpatient procedures were major hip and knee replacement and vaginal delivery without sterilization and D&C. The top outpatient procedures were computed tomography of the head or brain and colonoscopy.
We also find psychotherapy, basic metabolic panel and mammograms on this list. While no item on this list is surprising, procedure rankings for individual hospitals will likely differ and may include other procedures not listed.
This type of analysis is valuable for all providers, especially as sufficient time has passed to ensure the credibility of the findings. All providers therefore should assess their own statistics on price estimate requests to identify the procedures with the highest numbers of requests.
Such an assessment will give a provider a basis for evaluating other key considerations, including the tendency of patients to seek estimates of their self-pay amounts, the competitiveness of the provider’s charge description master (CDM) prices and the provider’s negotiated rates as compared with those of its peers.
Patient interest in their self-pay discount amount. Despite CMS’s requirement in 2021 for hospitals to publish their negotiated rates and provide such rates or out-of-pocket estimates to consumers with insurance, 40% of all estimates in the study sample were provided to consumers searching for their self-pay discount amount.
This is likely a response to the advent of high-deductible plans. Consumers choose these plans to reduce their premiums, but the high out-of-pocket deductible costs could be providing an impetus for them to forgo their plans and instead shop around for the best price.
Also, starting this year, most health plans are required to provide an online price[1]comparison feature on their website for consumers to compare out-of-pocket costs for 500 shoppable services. Self-pay and uninsured patients will still need to use hospital websites to obtain a cost estimate, but consumers using insurance coverage have the option to use a payer’s website or validate an estimate received on a hospital website.
The need for defensible line-item CDM prices. In the face of such trends, it is more important now than ever for hospitals and health systems to establish optimum line-item prices that are also defensible and competitive. These prices must be updated each year to reflect changes in unit costs, market data, payer fee schedules, contract terms, volume, payer mix, case mix and strategic financial objectives.
Providers also should ensure that their itemized estimates to self-pay or uninsured patients for scheduled services — reflecting what CMS describes as “good faith estimates” under the No Surprises Act — conform to or are reconcilable with the single out-of-pocket estimates patients are required to receive under the consumer display/patient estimation requirements of the CMS final price transparency rule.
The widespread use of the percentage-of charge discount. With a high percentage of consumer estimate requests being made for shoppable self-pay discount amounts, every provider organization must not only maintain defensible line-item charges, but also acknowledge the increased importance of its method for determining self-pay discount methodology. A recent unpublished review by Panacea of self-pay discount policies of more than 75 health systems — representing more than 175 providers and spanning across 17 different states — found that 90% of the providers have established their self-pay discount policy based on a simple percentage discount applied to the gross charges billed. The average discount is 30%, and most discounts ranged from 20% to 40%. Among these 175 providers, 20% of hospitals were teaching facilities, 35% were hospitals with more than 200 beds and 90% were short-term acute care hospitals versus specialty-based hospitals.
The few providers that did not use a percentage discount methodology tended to use the Medicare rate or methodology, or a percentage of the Medicare rate — an approach that is much more time-consuming to update each year. Thus, if permissible under state-specific regulations, providers using this methodology should consider changing their policy to be more in line with the industry norm.
Next steps for provider organizations
The key takeaways for providers from this research include the following four recommendations.
1 Track and monitor consumer activity seeking price estimates. With requests for price estimates on the rise and with 40% of consumers looking at charges for shoppable services such as mammograms, vaginal deliveries, CT scans and hip replacements, it is essential to monitor such activity. Understanding consumer preferences provides a basis for establishing competitive prices within the context of pursuing a holistic and strategic approach to ensuring the chargemaster’s net revenue neutrality.
2 Annually assess, update and maintain defensible, competitive yet optimum chargemaster prices and competitive self-pay discount policies of 20% to 40%. The importance of this effort will grow as consumers increasingly focus on comparing shoppable charges and as the average self-pay discount remains at 30%.
3 Ensure the consistency of information represented in the required consumer display MRF and in line-by-line “good faith estimates.” Providers should do so in light of the currently high percentage of self-pay searches. For example, a good faith estimate for an MRI of the chest should have the same estimated charges reflected in the MRF as in the consumer display and patient price estimation system.
4 Use the least complicated formula possible for determining patients’ self-pay discounts. Providers using the less consumer-friendly percentage-of-Medicare self-pay discount formula should consider a method that is simplified and easier to maintain and understand, such as the percentage of billed charges method.
Footnotes
a. CMS, “Medicare and Medicaid Programs: CY 2020 Hospital Outpatient PPS Policy Changes and Payment Rates … Price transparency requirements for hospitals to make standard charges public,” Federal Register, Nov. 27, 2019.
b. Bassford, C., and Leiback, J., “How hospitals are failing in meeting price transparency requirements,” Guidehouse, Feb. 9, 2021. This study consisted of over 1,000 providers across 27 states. Compliance was defined as the file’s being “present” on hospital websites and containing at least some or all five standard charges (i.e., gross charge, discounted cash price, payer-specific negotiated charge, de-identified maximum and de-identified minimum).