


Any payment system advanced under the heading of “Medicare for All,” where 100% of payments are based on Medicare rates, could severely disadvantage major academic medical centers and other tertiary hospitals that provide most Medicare outlier cases,

Hospital payment systems involve some of the most complex formulas in any industry. Their diverse payment methodologies — involving factors such as Medicare severity-adjusted DRGs (MS-DRGs), all-patients refined DRGs (APR DRGs), per diem payments, per case payments and outlier thresholds — use complex algorithms to determine how much a hospital will be paid for each inpatient stay. Yet proposed reforms, including the concepts of Medicare for All, raise the possibility that all payers, including commercial insurers, could be paid based on Medicare payment rates. If such an approach were adopted, the consequences could be devastating for hospitals with high outlier percentages.
With such a possibility on the horizon, hospitals will be challenged to create a new approach for measuring change and to formulate new outlier-excluded metrics that can help quantify how payments will be inequitably changed. A starting point for developing such a new baseline is the Medicare FOCUS model described in the article “Transitioning to a New Medicare-Based Benchmarking Paradigm for Commercial Payment.” [a]
The modified Medicare benchmarking system (MMBS) provides a tool for analyzing how all current hospital contract payments (e.g., Medicare, Medicaid and commercial) would be affected if payment were at 100% of the Medicare-based payment system. It is beyond the scope of this article to review the details of this system, except to say that it enables a hospital to more accurately compare its performance with that of other hospitals for like DRGs, in new categories, with and without outliers. The system also is particularly useful for hospitals with higher-cost quaternary and tertiary services, such as major academic medical centers (AMCs), because it enables them to more clearly understand their costs are substantially higher than lower-acuity hospitals. (Readers are referred to the previous article for details on how and why benchmarks are modified under the MMBS.)
The purpose here is to focus on the system’s usefulness in enabling hospitals to account for outliers. Such a system would be essential under a Medicare-for-All payment system to allow for fair benchmarking comparisons between larger hospitals with high percentages of outliers and smaller hospitals with much lower percentages of outliers. (See the sidebar “A single-payer system based on Medicare rates poses inherent challenges.”) ABC Hospital, referenced below, was created as a working example based on the experience of a California hospital to clarify the impact of outliers.
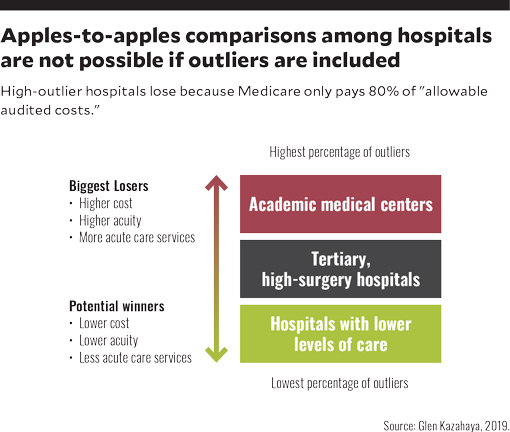
Hospitals lose with outliers because Medicare pays only 80% of “allowable” audited costs
A common myth is if a hospital has more Medicare outliers, it has a higher case mix index (CMI), and therefore gets paid more. However, the CMI for outliers and non-outliers is the same for all DRGs. Under the complex formula, Medicare pays only an incremental outlier amount (i.e., 80% of Medicare allowable audited costs) for each DRG, which is significantly lower than its actual incurred costs. This payment methodology means Medicare outliers invariably lose money on outliers.
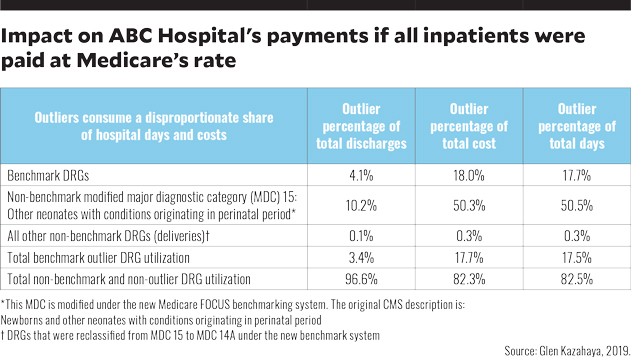
The chart below illustrates what the impact on ABC Hospital’s payments would be if all inpatients were paid at Medicare’s rates, including its outlier payment methodology. The exhibit shows outliers constituted only 3.4% of all discharges over a one-year period, yet they consumed 17.5% of the hospital’s patient days and 17.7% of its total costs. Outliers consumed 427% higher costs than non-outlier.
The foregoing chart is for ABC Hospital, which is a large tertiary hospital (not an academic medical center), with a high volume of OB, NICU, cardiac and musculoskeletal DRGs and surgical cases. It shows:
- Outlier discharges were 4.1% of total discharges for the benchmark DRG category and consumed a disproportionate share of total costs and total days (about 18% in each case)
- Outlier discharges for the modified major diagnostic category (MDC) 15: Other neonates with conditions originating in perinatal period (categorized as a non-benchmark item in the MMBS because it involves neonatal intensive care unit [NICU] services, which are paid by commercial health plans on a per diem rate, and not on a Medicare MS-DRG basis), were 10.2% of total discharges, but consumed 50.3% of total NICU costs and 50.5% of total NICU days
- All other non-benchmark outlier discharges were less than 0.1% of all total discharges in this category.
- Total non-benchmark and non-outlier DRGs represented 96.6% of all discharges but only 82.3% of total costs.
Benchmarking conclusions
Because of the disproportionate share of costs consumed for outliers compared with normal non-outlier DRGs, losses would be the highest for hospitals that provide more high-cost, high-acuity and high-risk outlier services (e.g., high-risk cardiac procedures, higher acuity surgeries and services delivered in neonatal intensive care units). Conversely, local and smaller community hospitals that may lack the resources or the ability to deliver such services would have lower outlier risks and typically lower costs under a Medicare-for-All payment system. In short, the high cost and utilization of outliers drastically increases the overall costs and presents unfair benchmark comparisons between high-outlier and low-outlier hospitals.
Without major changes to the outlier payment methodology, AMCs and larger tertiary hospitals would tend to suffer in a Medicare DRG-based payment system. Thus, to achieve reasonable comparisons between these hospitals and the lower-cost, lower-acuity community hospitals, outlier discharges should be excluded from all benchmark key indicator comparisons.
Other outlier lessons
If any future single-payer health plan doesn’t provide adequate stop-loss insurance to cover the full costs of outliers, hospitals delivering high-risk outlier services will be forced to reconsider whether they can continue providing these services. If the existing Medicare outlier-payment methodologies were not modified, these hospitals could continue to incur major, disproportionately high and unsustainable losses. And if it were to become unaffordable for them to continue providing high-outlier services such as NICU, transplants and major cardiac procedures, the nation could face serious access problems for patients requiring such services.
The chart below provides an executive summary of the major key indicators for ABC Hospital. The numbers demonstrate the potential one-year impact on this model hospital if all discharges were paid at 100% of Medicare rates.
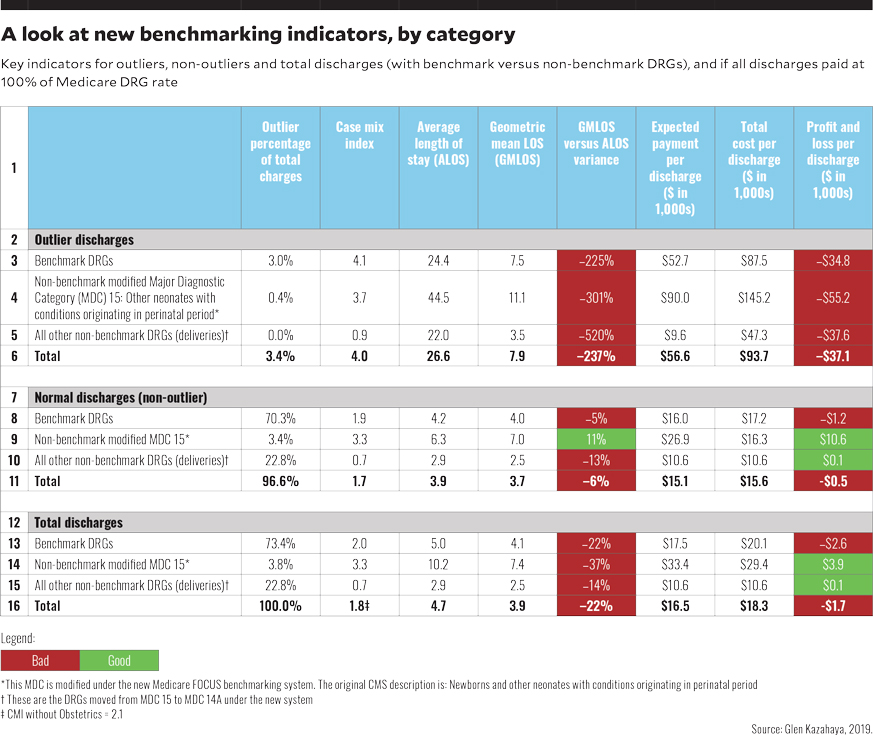
Row 16 provides the big picture: The overall CMI for ABC Hospital was 1.8, and the average length of stay (ALOS) was 22% higher than the geometric mean LOS (GMLOS). Many hospitals use GMLOS as their benchmark target for ALOS, and they would likely view exceeding GMLOS by such a large margin as an indicator that the physicians and case management have significant room for improvement. However, reviewing outlier benchmark and normal benchmark categories presents a completely different picture.
Outlier discharges. The CMI for all outlier DRGs (row 6), at 4.0, is more than twice as high as the CMI for all discharges, which is 1.8 (or 2.1 if deliveries are not included). The outlier ALOS is 237% higher than the GMLOS. These figures underscore for management the extent that outliers skew the key indicators and can distort the overall performance when compared with other low-outlier hospitals.
Normal non-outlier discharges. The overall ALOS was still 6% higher than the GMLOS, which is still high because the Medicare GMLOS includes outliers. For non-outliers, hospitals would want the ALOS to be lower than the GMLOS.
P&L implications looking at actual costs
Senior executives need to understand these how these changes impact their overall profit and loss (P&L) by major service lines to develop their strategic plan on what changes may be needed to survive or thrive if a Medicare-for-All program is adopted. To assess the potential effects on a large hospital if it were paid 100% Medicare payment for all discharges, a P&L analysis was performed for ABC Hospital, drawing on actual hospital financial statements to ensure the integrity of service line reports by major diagnostic category (MDC).[b] Here are some key findings of that analysis.
Effect on total discharges. If ABC Hospital were paid 100% of Medicare DRG rates, it would have lost $1,700 per discharge.
Effect on benchmark DRGs. Total discharges among benchmark DRGs (row 13) showed a loss of $2,600 per discharge. Yet outliers among benchmark DRGs lost $34,800 per discharge because the Medicare payment methodology paid only 60% of total costs (not Medicare Allowable costs). Not including the outliers, the loss associated with benchmark-DRG non-outliers still amounted to $1,200 per discharge. Yet it was noted that there remained significant cost-reduction opportunities for LOS and cost resource consumption that could lead to a breakeven or better.
The large Medicare losses for benchmark DRG outliers reinforce that outlier payments under a 100% Medicare-based payment system for all would be woefully inadequate, and they would need to be dramatically increased for the system to be viable.
Effect on modified MDC 15. This non-benchmark modified MDC showed an overall profit of $3,900 per discharge (row 14). Yet this profit reflected the impact of a $55,200 loss per discharge (row 3) associated with outliers, and when the outliers were removed from the picture, the remaining non-outliers showed a huge a huge profit of $10,600 per discharge (row 9). Because Medicare patients rarely deliver babies, they are usually higher risk, and consequently more costly. This reality skews the obstetrics (OB) payments because Medicare’s database does not include the lower-cost, lower-risk normal deliveries for non-Medicare patients. Hospitals providing care to high volumes of OB patients, no NICU services and minimal outlier services could be the biggest winners under a Medicare-for-All payment program.
Medicare very rarely pays for MDC 15 services, which are delivered in the NICU, so using MS-DRGs for payment of such services does not seem suitable for patients with commercial insurance or Medicaid coverage. The findings indicate ABC Hospital would have a windfall profit in this area among normal patients but would incur huge losses for the NICU outliers.
Effect on all other non-benchmark DRGs. These DRGs, which comprised OB deliveries, showed a profit of $100 per discharge. A single outlier incurred a loss of 37,600. (Separate payments for mother and newborn were combined.)
Benchmarking to other hospitals
For benchmark comparisons with other hospitals, it is most reasonable to use only the normal, non-outlier discharges (rows 7-11), thereby factoring out the outliers for which ALOS exceeds GMLOS by 22%. This approach is not perfect for an AMC, which may still have sicker patients, but it minimizes the skewing impact of an AMC’s higher percentage of outliers, such as is seen in the totals in row 16.
As major changes in payment for healthcare delivery are adopted, particularly if the industry moves toward adoption of a 100% Medicare-based payment system, the MMBS can help facilitate the development of new financial and key indicators by MDC/DRG to provide insight into where changes in the Medicare-for-All payment approach might be required. Hospital and health system CFOs can play an integral role in creating new management reports for hospital and physician leadership to help make the transition easier to understand and to promote ongoing financial success. (See also the sidebar “Implications for a CFO-led strategic response to a Medicare-based payment system.”)
Footnotes
a. Kazahaya, G., “Transitioning to a new Medicare-based benchmarking paradigm for commercial payment, hfm, October 2018.
b. The findings presented here represent only the surface of this analysis, which also drilled down to assess payment by the top 30 major payer groups, by MDC, by DRG, by physician and by payer.