


Physician Compensation
Physician Distribution, Mobility, Fair Market Value and Compensation Surveys
Published
July 3, 2018
11:17 am
|
Updated
December 9, 2024
11:02 am
An analysis of relocation trends and regional differences in compensation shows the market for established physicians is far more local than national.
When hospitals, health systems, and other entities employ physicians, it critical that they compensate the physicians at fair market value to achieve regulatory compliance. Establishing compensation at fair market value also is integral to the valuation of physician practices because it represents the key component for differentiating return on the labor or services the physicians provide, and the return on equity ownership of the practices.
In reality, coming up with a fair market value for physician services is no small task. The Stark regulations, for example, provide that the fair market valuation “methodology must exclude valuations where the parties to the transactions are at arm’s length but in a position to refer to one another.” a The Stark law also provides that “the fair market price is the price at which bona fide sales have been consummated for assets of like type, quality, and quantity in a particular market at the time of acquisition.” National salary surveys frequently have been cited as a basis for fair market value determinations. However, reliance on such surveys can be problematic because the underlying data tend to be significantly skewed and the results generally do not reflect the role of local market conditions in setting fair market value.
This assertion was supported by research into public data maintained by the Association of American Medical Colleges (AAMC) on the correlation between the states where physicians complete their residencies and/or fellowships (graduate medical education [GME]), and the states in which they eventually enter medical practice. b A comparison of these data with the distribution of providers in the Medical Group Management Association (MGMA) 2015 Survey produced illuminating results.
The research identified a disparate distribution of physicians regionally and by state based on the AAMC data. Yet the state-by-state and region-by-region distributions of data points in the MGMA survey do not match the actual distribution of physicians in the country reflected in the AAMC data, thus challenging the appropriateness of using the purported “national median”—which is merely the mid-point of the data set, with half the data below and half above—and other survey compensation data for physicians already established in practice when determining the fair market value of that compensation (e.g., data from MGMA, the American Medical Group Association, and SullivanCotter).
Mobility Considerations
Physicians in general are not nationally mobile. They are not prone to relocate after GME, and less so once established in practice, according to a 2008 study published in Health Affairs. c Overall, 38.7 percent of physicians who received their undergraduate medical education (UME) in a state were actively practicing in that same state. An even higher percentage—47.2 percent—of physicians were actively practicing in the same state where they received their GME. And despite the prevailing view in the appraisal community, the AAMC data indicate 68.4 percent of physicians who completed both UME and GME in the same state stayed on to practice in that state; that is, they did not relocate to earn a national median.
The research found that the Northeast and Midwest produce significantly more physicians than are required in those regions and export those physicians to other parts of the country that have a deficit of GME candidates. It further demonstrates that many areas of the country have very small recruiting areas, especially in the Northeast, where the vast majority of physicians practicing in that region also trained there. The actual distribution of physicians nationally and the data on the influence of GME on ultimate practice location are inconsistent with the use of national survey medians as a basis for determining fair market value compensation. Further, compensation surveys include data on arrangements where the parties are in a position to refer and do not reflect data in a particular market at the time of the arrangement.
To get a relevant national median for fair market compensation, one would have to obtain a statistically valid random sample by specialty for all physicians in the country—something that none of the compensation surveys attempts or claims to do. Even if such data were to exist, it would not account for the vast differences in payment rates for physicians’ services by health insurance companies from state to state and within states. d Given that work relative-value units (RVUs) are accepted as a means of measuring physician work output or labor, local market rates per RVU paid by insurers, generally based upon the Resource-Based Relative-Value Scale, are a threshold measure of local market fair market value.
Summary of Regional Findings
The MGMA Eastern region includes states stretching from Maine to North Carolina and West Virginia. The AMGA Eastern region includes the same geographic area. The Northeast region referenced by SullivanCotter does not include West Virginia and North Carolina. When opining on the fair market value of physician compensation, appraisers often cite so-called “national market medians,” “regional medians,” and other percentiles from the various surveys.
The Northeast, Midwest, and South regions used here are defined differently from those in the most recent MGMA survey based upon patterns observed by the author in the AAMC data. A significant number of physicians who practice in each region also trained in the same region. Reiterating, however, the Northeast and Midwest are exporters of physicians post-GME because the number of available GME slots available in these regions exceeds the need for physicians.
The implications for supply and demand as well as fair market value should be readily apparent. For example, physicians who train in the Northeast are the primary source of the supply of active physicians in the Northeast. Once a physician establishes his or her own practice, it is highly unlikely they will leave the Northeast and go elsewhere chasing a purported national median market rate of compensation.
Yet the national median data reported in the 2015 MGMA survey, for example, are based on data where one in seven of the providers in the survey sample practices medicine in Minnesota or Wisconsin. In the 2017 survey, one in four providers was from Minnesota, Wisconsin, or Pennsylvania. Certainly, the actual distribution of physicians does not reflect such a disproportionate number of physicians in those three states.
Differences in Regional Trends
Only the Midwest is examined in detail here, and physician training and distribution in the Northeast and South are summarized. Not shown are the Mid-Atlantic, West, Southwest, and Northwest, although California is described in detail later. e
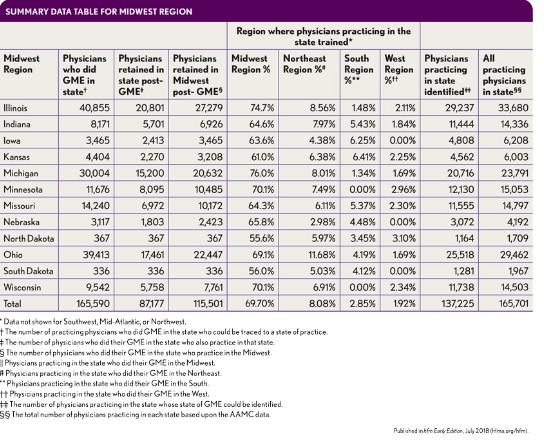
The Midwest. Physicians who trained in the Midwest show a striking level of retention, both within individual states as well as within the region itself. Of 165,590 physicians identified as having completed GME in the region, 115,501 (69.75 percent) were practicing there. f Of the 165,701 physicians practicing in the region, those 115,501 represent 69.7 percent.
The Northeast. The Northeast has a more striking level of retention, again, both within individual states and especially within the region. Of 231,263 physicians identified as completing GME in the region, 147,621 or 63.8 percent were practicing there. g However, this same 147,621 represents 81.2 percent of all the physicians practicing in the Northeast.
Given this context, it is a stretch to see how survey data with 25 percent of the data points from Minnesota, Wisconsin, and Pennsylvania would have much relevance to fair market physician compensation in New York.
New York. New York has 16,100 resident physicians, with 81.5 residents per 100,000 population, ranking it second overall among the states. In terms of active physicians per 100,000 population, New York ranks third, with 353.8. Of all physicians practicing in New York, 86.8 percent completed their GME in the Northeast. And of the active physicians in the state, 76 percent received their GME in New York, with the rest coming from various states, none of which represented more than 3 percent. h However, taken together, Pennsylvania, New Jersey, Massachusetts, and Connecticut account for another 10.2 percent of New York’s practicing physicians.
Of all physicians who completed their GME in New York, 45 percent remained there to practice. Of the others, 7 percent went to New Jersey, 7 percent to California, and 6 percent to Florida, with the remainder practicing in various other states. Finally, 58.9 percent of active physicians who did both their UME and GME in New York remained there to practice.
It is notable that 41.1 percent of New York’s residents and fellows are international medical graduates (IMG), the fifth highest rate, and 37.1 percent of practicing New York physicians are IMGs, the second highest rate. Research indicates that IMGs are less prone to relocate. i
The South. The South requires a more complex analysis. Being rural and having a comparatively low per capita income and limited GME slots, many of the southern states experience a shortage of physicians relative to their populations as well as relative to the presence of medical schools. Of the 144,737 physicians identified as completing GME in the South, 86.3 percent stayed in the South to practice. j Amounting to some 124,942 physicians, this number represents only 55.7 percent of the 224,460 physicians practicing in the region, because the South needs to import physicians to meet demand. This reality means that where the Midwest and Northeast import very few physicians and have little need for recruiting and compensation data outside their region the South needs outside data.
For example, for 52,264 physicians in Texas, it was possible to identify the state where the physician completed his or her GME. Of that number, 34,629 physicians—representing 62.36 percent of the total of 55,535 identified by MGMA as practicing in Texas—received their GME in the South. Moreover, the publicly available data indicate 51 percent of those 55,535 physicians (28,323) completed their GME in Texas itself.
The total number of physicians receiving their GME in Texas was 45,030, and 34,274 of these physicians stayed in the South to practice (although these numbers indicate 16,707 left Texas to practice elsewhere in the South). Texas gets the balance of its physicians primarily from the exporting regions in the Midwest and Northeast, notably New York (6.7 percent), with 2 to 3 percent each coming from Illinois, Michigan, Ohio, and Pennsylvania.
In contrast, more than 70 percent of all physicians practicing in Alabama, Louisiana, and Mississippi completed their GME in the South. Notably, Mississippi has the lowest number of physicians per capita in the country, due in part to the difficulty of importing physicians to a low income, rural state, with a poor payer mix. These factors indicate a requirement to subsidize local market rates.
Comparison with MGMA Data
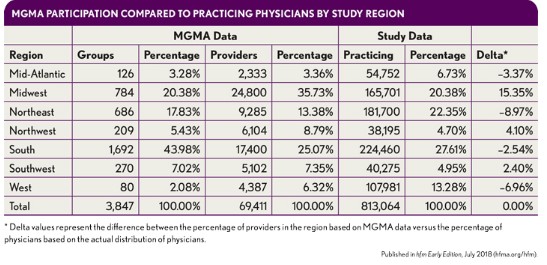
The provider data in the MGMA survey, which is most widely used as a basis for determining fair market value for compensation, show a distinctly different regional distribution than that of actual practicing physicians, with certain regions overrepresented and others underrepresented. k In particular, the Midwest is significantly overrepresented while the Northeast, the greatest exporter of physicians after GME, is significantly underrepresented. The delta values in the following exhibit clearly illustrate these differences, which not only further diminish the applicability of using national medians and other percentiles for fair market value determination, but also demonstrate that the survey does not represent the national or regional distribution of physicians.
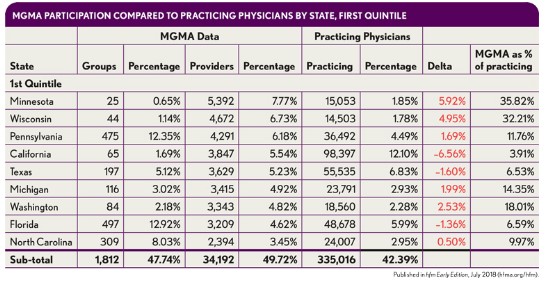
As can be seen in the exhibit below, state data are even more skewed than the regional data. As noted earlier, Minnesota and Wisconsin accounted for one in seven of every provider in the 2015 MGMA Physician Compensation Survey. States with large numbers of physicians, such as New York, do not even appear in the top quintile of data points. As such, the regional medians and other data typically relied upon in fair market value determinations are also equally as suspect as the national percentiles.
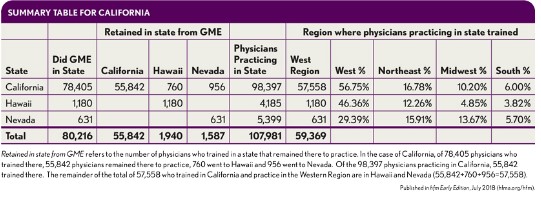
California. California, the largest state in the continental United States by population and area, has 10,142 residents, with 26.1 resident physicians per 100,000 population. As such, it ranks 31st overall among the states. In terms of active physicians per 100,000 population, California ranks 20th with 262.50. Of all active physicians in California, 57 percent completed their GME there and 8 percent did so in New York; no other state accounted for more than 3 percent.
Fully 70 percent of all physicians who completed their GME in California remained there to practice. Just 3 percent of the remainder went to Washington, and no other state accounted for more than 2 percent. Finally, 80.4 percent of physicians who completed both their UME and GME in California remained there to practice.
A simple regional analysis therefore is wholly inadequate for assessing physician recruitment to California. Yet 16.78 percent of California physicians come from the Northeast, 10.20 percent are from the Midwest, and 56.75 percent from the West, with most of those coming from California itself. Of those from the Northeast, 3 percent come from Pennsylvania, 2.8 percent from Massachusetts, and 8.4 percent from New York.
Put another way, 85 percent of the physicians practicing in California who trained in the Northeast came from just three states. Of the 10.2 percent who trained in the Midwest, 3.3 percent—nearly a third of that total—came from Illinois, while 2.3 percent came from Michigan and 2.1 percent came from Ohio. Those three states account for 75 percent of the physicians practicing in California who trained in the Midwest. l Here again, as a net importer of physicians, California requires external data on recruiting and compensation data—yet that information cannot be gleaned from national survey medians or, more specifically, the western region in a survey.
Impact on Physician Practice Valuation
The key element of valuing a physician practice for purchase/sale is the assumption of reasonable or replacement compensation for the owner(s) of the practice, which needs to exclude from the historic and forecasted compensation the return on equity ownership. The earnings of any physician practice are almost solely related to two factors:
- The rates they receive from insurers in their local market
- The level of cost they incur in delivering those services
Because it is not possible to make that core distinction from a survey median or other percentile, these sources are irrelevant.
Impact on Physician Employment Compensation Valuation
The findings of this analysis point to four categories of physician compensation valuation:
- Recruitment of a physician who has just completed GME
- Recruitment of a physician who is already in practice and must relocate
- Hiring of a physician who already is located in the employing entity’s service area
- Hiring of a physician who already is located in the employing entity’s service area where intangible value is being paid for the physician practice at the same time.
Following are summaries of the key factors within each of these categories that make national surveys, as currently structured, inadequate for providing a sound basis for determining fair market value of physician compensation.
Recruiting a physician who has just completed GME. California, as previously noted, is the largest importer of physicians and confronts a more national market. With 12.1 percent (98,397) of all practicing physicians in the country, 55,842 of whom completed their GME in California, nearly 48,000 had to be imported from elsewhere in the country. Most come from the Northeast (16.78 percent) and Midwest (10.20 percent), as one would expect due to excess supply in those regions, whereas only 6 percent come from the South, and many of those are from Texas. The Northeast states are substantially underrepresented in the MGMA survey, however, with only 13 percent of providers, compared with 22 percent of all practicing physicians and 31 percent of all GME slots. As such, expressing an opinion on fair market compensation requires more than survey information, including contacting physician recruitment firms about the current compensation packages being offered.
Recruitment of a physician already in practice and relocating. The critical difference between this category and that of the physician who has just completed GME is that this type of recruitment occurs very rarely because, as the AAMC data and the findings of the 2008 Health Affairs study demonstrate, physicians tend not to be mobile once they establish their practice. If there were a statistically valid survey sample of what other physicians in a particular specialty are paid when recruited to a new market, it would certainly be relevant to the expression of fair market value. The reason here is obvious: It is the local practice market that determines what a physician needs to be paid to practice there. The relevance of the physician’s existing compensation is primarily in contributing to the new compensation necessary to get him or her to relocate.
Hiring of a physician who already is located in the employing entity’s service area. Using a practice in New York as an example of practice valuation, the relevant recruitment market in New York is the Northeast region and only a handful of states in that region, as described earlier herein. The determination of fair market value for New York, therefore, would be more soundly based on data that reflect the unique dynamics of the Northeast region than on a survey that provides disproportionate data from two Midwestern states.
The use of survey data that is inconsistent with local market conditions has been shown to be a significant risk factor in regulatory actions where the commercial reasonableness of physician practice losses is challenged. In the 2005 case of Drakeford v. Tuomey Healthcare Systems Inc., for example, although expert testimony for the government relied upon MGMA median and 75th percentile compensation to work RVU ratios to claim that physicians were overcompensated, that same expert testimony observed that the recruited physicians testified in deposition they had no intent to relocate. m Clearly, these two positions are incongruous.
Hiring of a physician in the employing entity’s service area in connection with a purchase. Where the practice is being purchased, it is generally accepted that the physician compensation included in the business valuation model must be equivalent to the post-transaction compensation the physician will receive.
Conclusion
The most common defense of physician compensation survey usage for fair market value in the face of strong evidence that they lack statistical validity is that this is an accepted common practice. However, it’s high time that healthcare finance professionals more critically examine this practice. If nothing else, those charged with establishing fair market value should take a deeper dive into the available data and attempt to account for local market practices and conditions.
There are circumstances, to be sure, where a national search may need to be undertaken for a given physician, such as a neurosurgeon who trained in the Northeast and is needed in the South, or for a Department Chief in a teaching hospital anywhere in the country. Although not presented due to space limitations, the research on which this article is based also finds the expected challenges for recruiting physicians to practice in a rural location. That does not mean, however, that every physician should be compensated in the local market where they practice on the basis of survey results that incorrectly are accepted as representative of a homogenous national market for established physicians. Such a homogenous national market simply does not exist.
The routine use of such surveys as the basis for paying physicians already practicing in a given market when they become hospital or health system employees or for the valuation of a medical practice for sale in that local market is indefensible, and would be indefensible even if the surveys represented a statistically valid sample of what physicians earn nationally, given the evidence of regionalization and micro-regionalization of post-GME practice, and the vast differences in insurer payment rates. The latter are a primary indicator of local fair market value, at least for private practice physicians who are willing to work for them and do not relocate.
Physicians are not mobile once established, and that establishment commences at completion of graduate medical education. Employers, physicians, and appraisers need to focus on their local market conditions, including payment rates from health insurers, and disabuse themselves of the notion that existing survey data are an appropriate basis for determining fair market value. This, in turn, will guard against regulatory attacks on the commercial reasonableness of practice losses. Where recruitment from outside the local market area is required, hospitals and health systems should proactively measure any loss likely to be incurred by comparing local market rates per RVU to the expected compensation per RVU and include this in part of their documentation of the need for the physician.
Footnotes
a. Centers for Medicare & Medicaid Services, “Medicare Program; Physicians’ Referrals to Health Care Entities with Which They Have Financial Relationships (Phase II); Interim Final Rule,” Federal Register, March 26, 2004.
b. Association of American Medical Colleges, 2015 State Physician Workforce Data Book , 2015.
c. See, for example, Ricketts, T.C., and Randolph, R., “The Diffusion of Physicians,” Health Affairs, September/October 2008.
d. See, for example, Dietrich, M.O., “Using Work RVUs and ‘Particular Market’ Rates to Establish Fair Market Value Physician Compensation,” Chapter 17, BVR/AHLA Guide to Healthcare Industry Finance and Valuation , 2016; Center for Studying Health System Change, “Wide Variation in Hospital and Physician Payment Rates Evidence of Provider Market Power,” Research Brief No. 16, November 2010; Cordaro, E., and Smith, T., “How Local-Market Payer Rates Impact Physician Compensation: A Study of Midwestern Markets ,” Chapter 43, BVR/AHLA Guide to Valuing Physician Compensation and Healthcare Service Arrangements, 2017.
e. The focus on the Midwest here is intended simply to limit the scope of this discussion. The author has conducted the same in-depth analysis on each region and almost all states.
f. Of the total of 195,290 physicians reported as practicing in the region by AAMC, it was not possible to identify 33,330 of them from the publicly available data.
g. Of AAMC’s reported total of 246,725, only 15,796 could not be identified from the publicly available data.
h. Readers should recognize that the count of active physicians in a state of necessity differs from the count of physicians who completed their GME in a state. New York, for example, “graduates” considerably more residents than it has active physicians.
i. Polsky, D., Kletke, P.R., Wozniak, G.D., and Escarce, J.J., “Initial Practice Locations of International Medical Graduates,” Health Services Research, August 2002.
j. Of AAMC’s reported total of 172,926, only 28,189 could not be identified from the publicly available data.
k. MGMA states have been re-grouped by the regions used in this study.
l. It is likely that additional analysis would find that some physicians who have left a state after having received their GME there have moved to the state where they grew up or completed their UME.
m. United States ex rel. Drakeford v. Tuomey Healthcare Systems, Inc., No. 3:05-cv-02858 (D. S.C. 2010), ECF No. 358-3.