


Practice Improvement
5 high-leverage areas for improving medical group financial performance
Published
July 31, 2020
1:08 am
|
Updated
December 13, 2022
4:09 pm

In an integrated health system, many aspects of a medical group’s performance hinge on system-level decisions that are outside the group’s control. By examining specific areas, the group can focus on viable improvement opportunities.
Medical groups have been hit hard during the COVID-19 pandemic, putting the long-term viability of some groups in question. As health systems and medical groups face heightened pressure to improve financially, a key question is how to gauge performance.
Investment per provider, a commonly used metric, tells only part of the story.a That measure can be impacted by numerous factors, such as expense allocation and overhead costs, that are outside the control of medical group operations and thus nonactionable.
By instead examining five high-leverage areas within medical group operations, organizations can identify nearly all available improvement opportunities. Comparing these five areas against benchmarks helps pinpoint aspects of operations that can be addressed to improve performance.
1. Provider productivity
Provider productivity is key to the financial viability of a medical group, whether in a fee-for-service environment or further along on the continuum to a value-based system. The move to value has not progressed as quickly as expected for many organizations, and wRVUs remain the gold standard by which to measure performance for clinicians who aren’t shift-based.
Benchmarking provider productivity by specialty, as illustrated in the exhibit below, can support group performance in multiple ways. Benefits include:
- Setting realistic expectations for production at both the individual and department levels
- Highlighting provider capacity restrictions and opportunities
- Establishing appropriate clinic staffing levels based on volume
It is important to regularly share with providers how their productivity compares with like specialties regionally and nationally. That line of sight helps with the conversation if a provider’s productivity is below organizational targets.
In addition, visibility into provider productivity should feed into the organization’s recruitment planning. For example, some organizations have instituted criteria that allow recruitment of additional providers only when existing providers are at a specific level of productivity compared with benchmarks, such as the median or 60th percentile for their specialty.
A new consideration for provider productivity is the rapid deployment of telemedicine due to COVID-19. This modality needs to be evaluated to determine what percentage of face-to-face visits it will permanently replace, as well as the reimbursement variance once post-COVID-19 fee structures are finalized.
Compensation and Productivity Benchmarks
| Internal Medicine | # of Providers | 25th Percentile | 50th Percentile | 75th Percentile | 90th Percentile |
| National Compensation | 7,367 | $232,676 | $273,254 | $313,651 | $407,321 |
| Compensation per work RVU | 5,268 | $47.94 | $55.54 | $68.44 | $90.15 |
2. Provider compensation
Alignment between provider compensation and productivity is critical, and not only for the sake of regulatory compliance. Remaining market-competitive is important for recruitment and retention and for maintaining stability in your provider workforce, especially as volume ramps back up after the COVID-19 peak.
As with production, provider compensation benchmarks such as those in the exhibit above can be organized by specialty and viewed at national or regional levels. Benchmark surveys also show emerging trends such as the percent of compensation that is at risk in value-based contracts or paid according to nonproductivity incentives (e.g., patient satisfaction, clinical quality, citizenship, patient access, care coordination).
3. Net professional revenue
Examination of net professional revenue provides multiple angles for identifying opportunities in health plan contracting and revenue cycle performance.
For example, benchmarking net professional revenue per wRVU for each specialty, as illustrated in the exhibit below, can identify potential payment issues. In negotiations with payers, integrated systems often suppress or flatten rates for medical group services to obtain better rates for hospital services, which typically represent higher revenues. Identifying this gap through benchmarking analysis of like specialties can highlight that payer contracting rates typically are beyond the control of medical group operations, helping health systems appropriately assign responsibility for improving net revenue.
Health plan contracts also should be reviewed to ascertain whether they are market-competitive and whether the negotiated rates actually are being paid.
Identifying variances in net professional revenue also can clarify opportunities to improve revenue cycle performance. If a negative variance to the net-revenue benchmark exists, the organization should conduct a deeper dive into front-end and back-end revenue cycle processes by examining:
- Accounts receivable metrics
- Collection and denial rates
- Lag time to billing
- Service-level agreements
A comparison of revenue cycle metrics across multiple clinics can identify any lack of standards in key areas, such as insurance verification, prior authorization and charge capture.
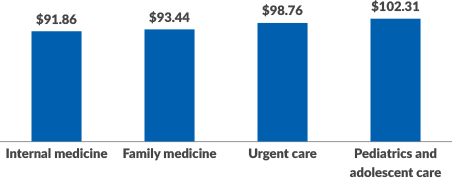
Median Net Professional Collections per wRVU
4. Clinic staffing
Even within organizations that strive to use a standard staffing matrix across their clinics, there can be a great deal of variation in staffing levels. Just as provider production can tell a story about capacity and efficiency, clinic staffing should be adjusted for patient volume to enable maximum provider productivity.
Aligning clinic staffing with production is critical to establish a high-performing operation. Comparing staffing levels among similar specialties against industry benchmarks, as seen in the exhibit below, is a way to identify whether overstaffing or understaffing exists.
As telemedicine becomes more central after COVID-19, clinic staffing models may change due to a shifting of roles and responsibilities. Staffing ratios thus may change or need to be adjusted.
Median Clinic Staffing FTEs per 10,000 wRVUs
| Staffing Category | Registered Nurses | Licensed Practical Nurses | Medical Assistants/Nurse Aides | Medical Receptionists |
| Family Medicine | 0.87 | 0.85 | 1.81 | 1.47 |
| Internal Medicine | 0.58 | 0.48 | 1.95 | 1.75 |
| Pediatrics and Adolescent (General) | 1.31 | 0.54 | 1.39 | 1.67 |
5. Operational expenses
Operational expenses should be adjusted for volume and compared with market metrics on a line-item basis to ensure no savings opportunities are left on the table. Beyond staffing and compensation, opportunities typically can be found in the following areas.
Drugs. If drug expenses are higher than the benchmark, organizations should analyze payment to ensure it covers cost. A review of inventory management should be conducted to ensure over-ordering or drug waste through expiration is not contributing to the higher costs. In addition, the medical group may be able to take advantage of health system contracts that provide lower pricing.
Medical/surgical supplies. Any negative variance to the benchmark should be addressed through both price and utilization approaches. Contracting opportunities for supplies often are centralized within a health system, but individual clinics do not always follow the rules, and compliance with purchasing standards requires a partnership among different areas of the organization.
Internal and historical trends are useful in identifying issues with utilization. A strong inventory management system can help the group minimize waste from excessive or expired inventory and unnecessary supply-acquisition expenses.
Building and occupancy expenses. Facility costs could change dramatically coming out of the pandemic. Less exam-room space may be needed depending on the degree to which telemedicine is adopted, for example, but on the other hand, waiting rooms may need to be reconfigured to accommodate social distancing.
Certain positions such as billing representatives may be allowed to continue to work remotely, thus decreasing the need for administrative space.
Acting on the insights
After reviewing the five high-leverage areas and identifying opportunities, organizations should establish a team, composed of both medical group and health system administrators, to evaluate variances and prioritize additional analysis or a plan of action. The team should use scenario planning to understand the impact of COVID-19 on future operations.
A project plan should be created to ensure the initiative remains on track and that appropriate individuals and departments are assigned to each area of opportunity.
A defined process to ensure coordination between the medical group and the health system is critical to avoid wasted efforts and finger pointing, given that system-level decisions commonly create situations that are outside the control of medical group operations. These discrepancies should be discussed to ensure accountability aligns with control and that improvement targets are set appropriately.
These steps tip the scales to support an aligned approach and increase the likelihood that the medical group will achieve and maintain performance improvements.
Footnote
a. By this standard, results were improving in recent years: The level of investment per provider declined from $243,918 in 2017 to $201,042 in 2018, according to the American Medical Group Association’s “2019 Medical Group Operations and Finance Survey.”
Why downstream revenue should not be an area of focus for medical groups
Much has been written about downstream revenue from medical groups to the health system. However, amid the shift from volume to value, medical group performance should be evaluated on its own rather than justified by its revenue contribution to the health system.
Adding downstream revenue to the equation can mask or even justify suboptimal performance of the medical group. The value proposition of the medical group includes the integrated medical staff, the shared electronic health record platform, a longitudinal focus on wellness and chronic care and more-efficient handoffs between specialists.
The focus of this article thus is on scrutinizing processes and individual line-item variances to identify actionable steps and improve medical group performance without considering downstream revenue to the health system. Once those aspects are understood, the hard work of improvement can begin.