


Fast Finance
Most hospital revenue is not from patient care
The finding identifies a key support that allows hospitals reporting negative operating margins — such as the 39% with negative operating margins in 2023 — to continue operations.
Published
March 30, 2026
4:06 pm
Hospitals derive only about one-third of revenue from patient care as low public payer rates and other factors have driven them to find other income sources, according to a new analysis.
Net patient revenue was a median of 29.9% of gross revenue across nonfederal short-term acute care hospitals in 2024, according to an analysis by Trilliant Health, a consulting firm for health systems, payers and drug manufacturers.
“We found that to be pretty staggering,” Allison Oakes, PhD, vice president and chief research officer at Trilliant Health and an author of the analysis, said about the revenue sources in an interview.
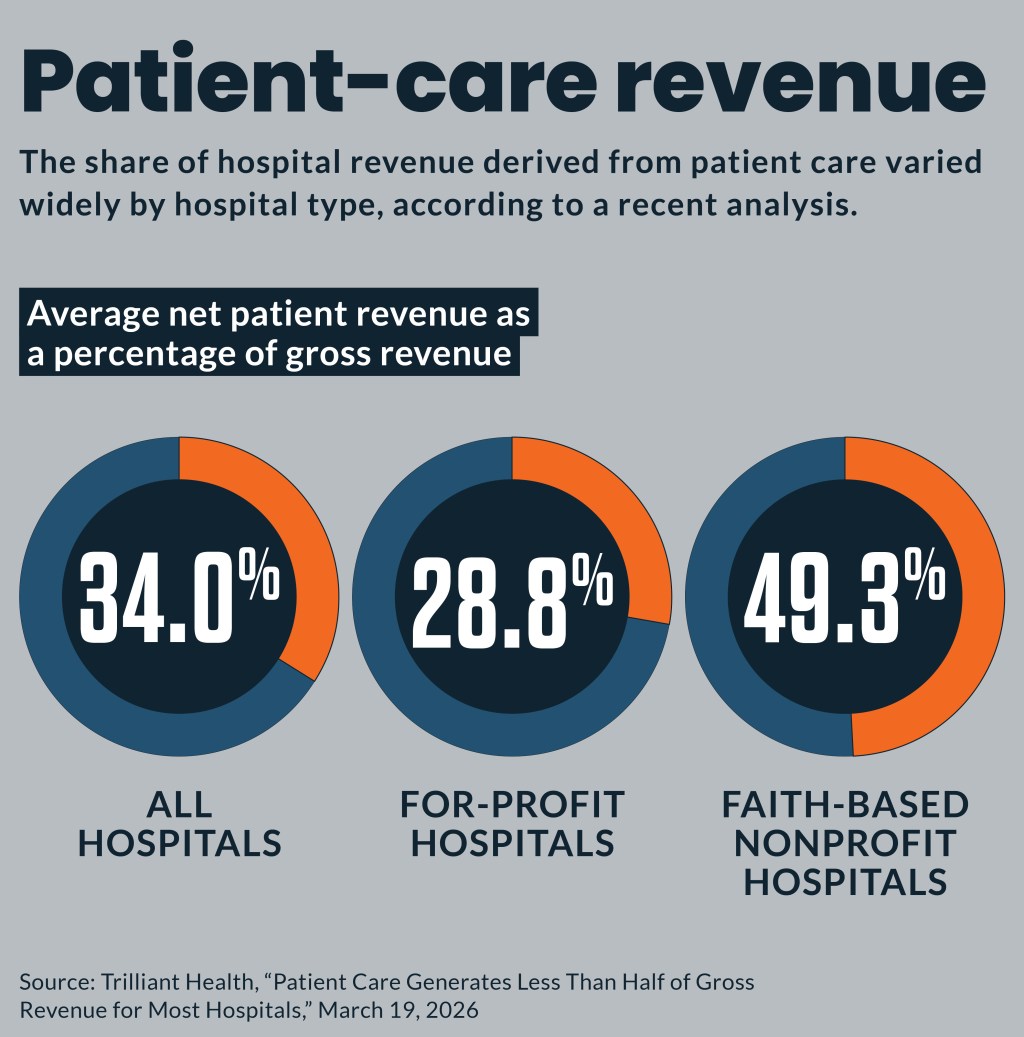
Net patient revenue as a percentage of gross revenue ranged from 8.3% to 86.6% across hospitals. It averaged 34.0%. It averaged 28.8% for for-profit hospitals and 49.3% for faith-based nonprofit health systems.
Christopher Whaley, PhD, an associate professor at the Brown University School of Public Health who studies hospital finances, also was surprised about the extent to which nonoperating sources of revenue often cross-subsidize hospitals overall.
“This is an important study and timely for how we think about hospital-based finances,” Whaley said in an interview. “It adds a lot of important transparency to the discussions.”
Why it matters
The finding identifies a key support that allows hospitals reporting negative operating margins — such as the 39% with negative operating margins in 2023 — to continue operations.
Oakes said hospitals are forced to generate such large shares of revenue from nonpatient care due to a combination of factors. Those include underpayments from Medicare and Medicaid; inefficient management driving administrative cost; and location-driven costs.
Although the study did not delve into the types of nonpatient-care revenue, those can include market investments, state and federal grants, philanthropy and state loans or real estate income, she said in an interview. Nonpatient-care revenue sources that have taken on larger roles in recent years include medical device sales, pharmacy operations, infusion services and the 340B program.
“The big question for us to assess as health economy stakeholders, but also as a society more broadly, is what do we think it means that hospitals generate so much revenue from nonpatient-related activities?” Oakes said. “Do we think that’s something that makes sense? Do we think that’s something that should continue? Or do we think that we should reconsider our reimbursement structure?”
Nonpatient expenses
The analysis also examined the share of operating costs consumed by nonpatient-related expenses.
The median share of nonpatient-related expenses was 14.6% of operating expenses, while the average share was slightly higher at 16.0%. Those ranged from 0.2% to a high of 51.1%.
“What these two results together convey, which is certainly a theme that a lot of people are talking about, is just how complex hospitals are and how complex our healthcare system is,” Oakes said about the revenue and expense findings.
Operating expenses
The analysis also identified the median share of various components of total operating expenses, which included:
- Direct patient care labor, 23.9%
- Nonpatient care labor costs, 12.6%
- Drug costs, 6.1%
- Capital-related costs, 4.8%
- Uninsured care, 1.0%
- Bad debt, 1.1%
“Direct patient care labor is where hospitals are spending the largest proportion of their funds,” Oakes said. “That said, in the scheme of 100%, only a quarter is going to direct patient care labor; in some senses, that might seem a little bit low.”
A previous Trilliant analysis found that nonpatient expenses at hospitals had grown more quickly than direct patient care expenses over a recent 12-year period.
Market vulnerability
Since many hospitals are generating most of their revenue from nonpatient care sources, factors outside of payer dynamics can have outsized effects on their finances, Oakes said. Many hospitals have created large investment portfolios that could face large losses in any significant market downturn.
“Because hospitals are sort of exposed, in the sense that they aren’t able to generate large enough margins from direct patient care specifically, they have to diversify in these ways,” Oakes said. “They are open to exposure in the open market in the same way that other companies or individuals are, as well.”
That’s what Whaley and colleagues found had occurred in 2022 when the S&P declined 20% and private equity funds also fell sharply.
At 10 nonprofit health systems they examined, the average overall profit margin decreased from 9% in 2021 to -6% in 2022. But patient care revenue at those organizations slightly increased by nearly 1% during that same period, according to their research. It concluded their overall margin decrease was driven by investment losses.
Heavy reliance on non-patient revenue could indicate other problems.
“While these non-clinical sources help many nonprofit health systems achieve positive margins, they also mask the challenges facing hospitals as a result of their inability to effectively address the cost side of their clinical operations,” said Thomas Campanella, president of Campanella Consulting, a healthcare consulting firm.
Campanella said hospitals will need to target costs to compete with value-based options in the fast-growing outpatient and home care settings.
Margin variation
In addition to finding that 39% of hospitals had negative operating margins in 2023, the analysis reported 14.5% operating margins of at least 15%, and 22.1% generated operating margins between 0% and 5%.
Whaley said the findings could catch the attention of policymakers.
“This certainly goes to show that there are the ‘have’ and ‘have not’ hospitals,” Whaley said. “And when we’re thinking about financing or other regulatory discussions, it is important to make sure that resources intended for the ‘have nots’ are not diverted toward the ‘haves.’”
An example of such a policy he cited was Oregon’s 2019 law capping hospital rates at 200% of Medicare rates, while exempting safety net and critical access hospitals.
However, an Oregon hospital advocate blamed the law for deteriorating finances at those facilities and multiple subsequent hospital closures.
The new Trilliant analysis primarily used Medicare cost reports, which hospitals have questioned as incomplete and inaccurate. But since providers are required to submit the data under threat of punishment for perjury, researchers consider it the gold standard of hospital financial data.
“We have to think it’s the best available data out there, as it relates to hospital finances, but we also treat the data in a way to try and control for any weird outliers that we see,” Oakes said.