


Finance and Business Strategy
Trend suggests the nation’s largest hospitals should prepare for declining available revenues
June 30, 2019
10:03 pm
The average annual total patient revenue for the nation’s 215 largest short-term, acute-care hospitals amounted to $4.18 billion, according to data from Medicare fiscal years 2015-16 through 2017-18.a Yet rising allowances and discounts for these hospitals pose a concerning trend.
Allowances and discounts averaged more than $3 billion over the three-year period referenced above, with the result that the true available revenues were just under $1.2 billion. For the most part, allowances and discounts constitute the difference between a hospital’s charges and a negotiated allowed figure between the hospital and a government or commercial insurance carrier. These differences reduce the amount a patient is potentially responsible for after all insurance payments have been taken into account.
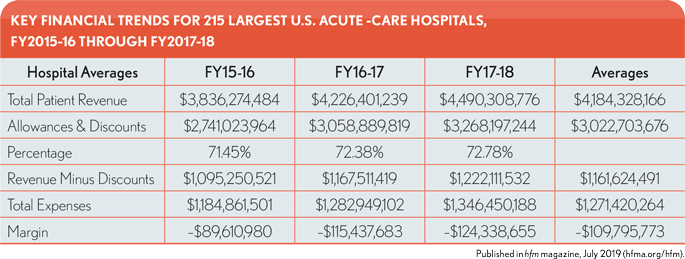
The differences also represent an accounting loss of more than 72% of total billings, leaving these hospitals with just 28% of revenues to cover expenses and other operating items. Although it does not represent a dramatic trend, the level of allowances and discounts as a percentage of total patient revenue also increased over the three years from 71.4% to 72.8%. Yet the actual dollar increase in allowances and discounts over the three years was 19.2%, outpacing the 17% increase in patient revenue by over 2 percentage points. For the same period, expenses increased nearly 14%, putting additional strain on hospital operating margins and underscoring the importance of patient revenues in helping cover these increasing costs.
The same hospitals showed expenses averaging $1.27 billion, translating into an average net loss per hospital of over $100 million per year. It therefore falls to other non-patient-related revenue sources, such as interest and investments, to make up the diff erence and allow these hospitals to stay profitable.
Although hospitals can negotiate new or updated allowances and discounts with their various network carriers, a more practical approach to cost containment may be to identify high-cost areas and departments in which measurable systemwide changes could be made. Cost reductions and containment could be beneficial across all patient populations, whereas negotiated discounts would be different levels and affect only a portion of the total patient population. With costs increasing year over year, the impact of identifying and addressing the root causes of the rising costs could help to ease these hospitals’ reliance on non-patient revenue streams as the primary means to remain financially solvent.
Footnotes
a. The “largest” hospitals were defined as those having 500 or more beds, and the fiscal years identified are the most recent ones for which data is available for assessing revenue performance.
The data source for this analysis is a database of hospital utilization and fi nancial information constructed from audited financial statements provided by more than 800 individual hospitals spread across the United States, and from Medicare Cost Reports from all U.S. hospitals that have treated a Medicare benefi ciary during the years covered by the database. The financial statements also represent both inpatient and outpatient hospital data, allowing for a more complete picture of each hospital’s overall patient results.
This analysis was provided by Optum Payer Solutions consulting. For more information, please contact Jan Welsh at [email protected].