


Analytics
Using Predictive Analytics to Align ED Staffing Resources With Patient Demand
Published
January 29, 2018
11:25 am
|
Updated
December 28, 2022
12:49 pm
A hospital in Grand Rapids, Mich., used management theory and data analysis to design and implement a much more precise model for setting staffing levels in its emergency department.
Patient demand for emergency department (ED) services in the United States has increased by 50 percent since 1994, magnified by a statistically significant increase of ED visits in states that expanded Medicaid under the Affordable Care Act (ACA) and a 13 percent decrease in the number of EDs. a These two factors, among others, have contributed to ED overcrowding and dynamic swings in patient visits. The resources required to care for the dramatic influx of ED patients is a long-standing management dilemma.
Increased demand for services occurs when the number of patients presenting to the ED for treatment exceeds the ED resources to meet the demand. Stated in economic terms, ED overcrowding is a result of an imbalance between supply (spaces and staff) and demand (services). This imbalance has been explained as resulting from multiple factors, such as boarding of ED patients waiting for inpatient beds, prolonged turnaround times for lab and imaging results, patients presenting with nonemergent problems, and surges in patient arrivals.
For several decades administrators, clinicians, and researchers have agreed that overcrowding is dangerous, unduly exposes the hospital to risk, and provides a less-than-optimal patient experience. b
Past attempts to remedy high ED demand have included the relocation of patients, process improvement initiatives, and improvements in staffing productivity. Notable patient relocation efforts have included the following:
- Directing patients with less acute conditions to a more appropriate setting
- Removing the patients from the general ED milieu
- Developing special units for patients presenting with acute onset of chest pain or stroke-like symptoms
Measurement or validation of overcrowding and the removal of inefficient processes are commonly used process improvement initiatives. Other approaches that have resulted in limited improvements in staff productivity include efforts to eliminate inefficient use of resources and use of staffing models that allocate labor resources using historic daily trends. c All these solutions have improved the throughput of patients. however None, however, address the root problem of the malalignment of staffing resources to patient demand. ED managers therefore still have room to improve their approaches to addressing overcrowding.
From a resource management lens, four tools are commonly used to validate high ED demand:
- Emergency Department Crowding Scale (EDCS)
- Real-Time Analysis of Demand Indicator Score (READI) d
- Emergency Department Work Index e
- National Emergency Department Overcrowding Study (NEDOCS) f
All these tools have demonstrated the ability to accurately identify high demand, while portions of the READI, EDWIN, and NEDOCS tools have demonstrated mild predictiveness. The major limitation of these tools is their inability to predict future demand, which would allow managers time to adjust resources appropriately. Staffing models allow managers to predict day-of-the-week staffing needs based on historical data. The results can be adjusted by season of the year, but the method still fails to address dynamic changes that occur during the day. g Here, we report the findings of a study that assessed a new management tool designed to allow managers to forecast patient arrivals within two hours and adjust staffing resources to meet variable demand throughout the day.
Study Design
The study was a collaborative effort between faculty in the Master of Health Administration program at Grand Valley State University in Allendale, Mich., and ED leaders at Butterworth Hospital in Grand Rapids, Mich., a subsidiary of the Grand-Rapids-based health system Spectrum Health. The study’s aim was to apply management theory and data analysis to solve a known operations problem. The study was granted exempt status by the Institutional Review Boards of Grand Valley State University and Spectrum Health Butterworth Hospital.
Butterworth Hospital’s ED serves a growing urban population in the area surrounding Grand Rapids, with reported annual visit volume for fiscal year 2016 exceeding 109,000 patient visits. ED staffing models prior to the study used rudimentary statistics that suggested the ED should plan to deliver services to 307 patients per day. To meet the high demand of presenting patients, management calculated the total daily nursing hours required through the following equation:
Average patient visits per day X2.55 nursing hours per patient visit (HPPV)
Historically, this model was rigid and inflexible, varying only by weekday and weekend within a fiscal year. Because the model did not reflect the actual numbers of patient visits at any given time, the department routinely experienced significant staffing variances during months in which patient visits per day were substantially higher or lower than the average of 307 patient visits.
To improve staffing resource management, retrospective data from the Butterworth Hospital’s ED was used for time series analysis (TSA) and time series modeling. TSA involve the use of a set of data points cataloged across a defined range of time, typically depicted in a linear graph. The method has been used extensively for strategic and operational planning, and has been shown to be a useful tool for forecasting ED demand. h The researchers at Butterworth Hospital used existing software for data query (Business Objects) and analysis (Excel) to create a staffing model that meets the demand of fluctuating arrival quantities within budgetary constraints.
The personnel requirements necessary to replicate this tool include the following:
- A data or financial analyst who can write patient data reports and understands how to perform data and statistical analysis
- Nursing leader(s) who have skill in using data analysis to model performance
- Charge nurses who are willing to assume responsibility for routinely making a small set of data entries when planning for adjustments in staffing levels (currently every 2 hours prior to shift change with the ultimate goal to run as needed) to plan for and adjust staffing levels
Data Collection
To collect the detail required to use the tool, Butterworth Hospital’s ED uses an electronic health record (EHR) that can provide documented patient information. Select data from this EHR is loaded into the hospital’s enterprise data warehouse, where it is further processed and standardized to create specific datasets. For this study, a report of retrospective data from June 2015 to May 2016 was created. This report consisted of indexed daily patient arrival quantities per hour of the day, which were exported to Microsoft Excel for analysis.
Data Analysis
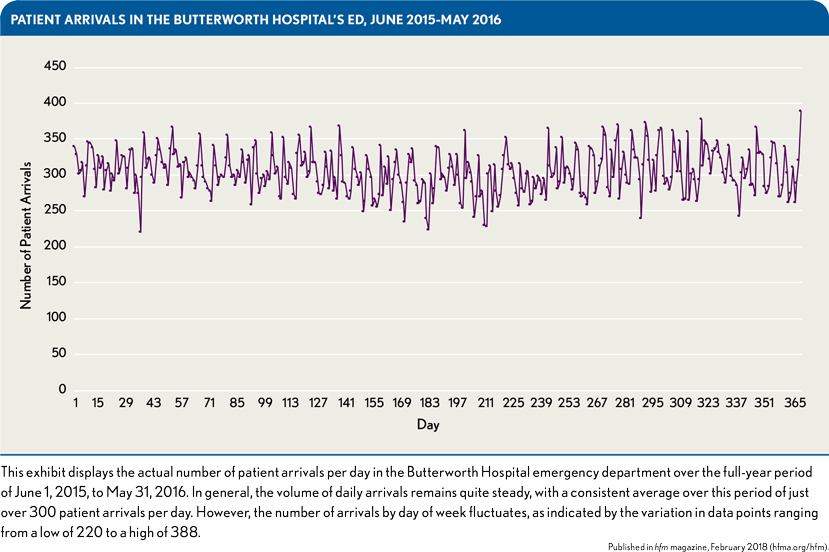
Time series techniques were used to produce daily means for staffing across days of the week. Overall, the average number of patient arrivals per day was just over 300, with a statistically significant variation ranging from 220 to 388, as shown in the exhibit above. By organizing the data into months, the researchers were able to detect natural three-month groupings, reflecting seasonal patterns. The researchers then examined the data for each season by day of the week looking for daily patterns. Similar volumes were noted in four day-of-the-week data groupings:
- Weekends (Saturday and Sunday)
- Mondays
- Tuesdays
- Wednesdays through Fridays
Based on these groupings of days representing different ED volume patterns, it was possible to enhance the existing validated labor forecasting tool to create a more reliable forecast of patient arrivals according to typical seasonal hourly patterns within these four time frames. The rationale was that forecasting volume in smaller increments of time would provide charge nurses more opportunities throughout the day to adjust staffing to anticipated demand. The exhibit below compares a Monday four-hour forecast produced prior to the enhancement by the labor forecasting tool with an enhanced two-hour forecast and an enhanced two-hour average forecast. The enhanced two-hour average forecast—produced by averaging a two-hour and three-hour forecast based on historical data specific to the particular season and day of the week—was found to provide the best result.
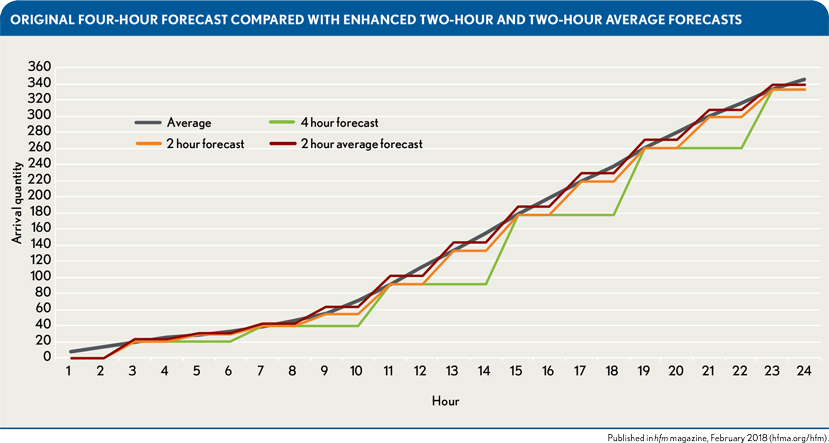
To determine the most highly correlated forecasting model, the study used an average arrival quantity for Mondays from July through August. Four-hour intervals demonstrated strong correlation, and further refinement at two-hour intervals demonstrated no statistical significance between actual and forecasted arrival times within any of the seasons.
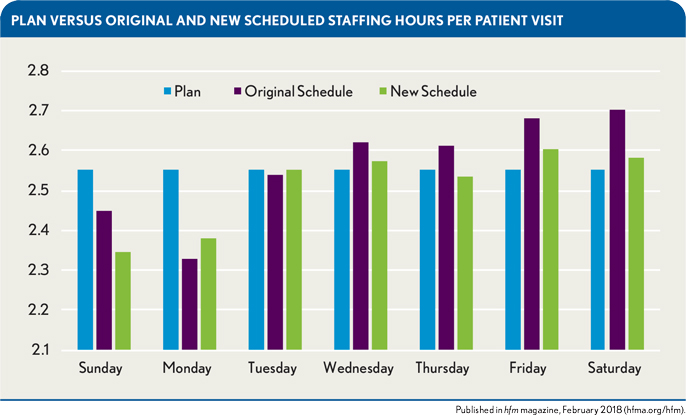
To achieve the most efficient and effective staffing hours per patient visit, a staffing model was implemented that matched the staffing schedule to the seasonal forecast specific to each day of the week. The exhibit below, for example, shows an improvement in hours per patient visit (HPPV) over the summer season (June, July, and August) that resulted from implementation of the new staffing model. The forecasts under the model proved accurate for all days except Sunday. Moreover, notably, the actual HPPV under the new schedule for Tuesdays was an exact match for the planned HPPV.
Benefits of the More Precise ED Volume Forecasting Model
Prior to the implementation of this study, Butterworth Hospital had significant overtime costs. Patient demand and department staffing were misaligned, costing the department $241,340 in overtime wages. Time series techniques presented in this study allowed for the evaluation of seasonal patient arrival patterns by day of the week and hour of the day. The significant results of this analysis led to the creation of baseline staffing templates and the enhancement of existing forecasting tools. As a result, the authors of this study generated an enhanced two-hour average forecasting tool to more closely align staffing models to meet the demand of fluctuating arrival quantities.
At the start of fiscal year 2017, Butterworth Hospital ED management operationalized the findings of this study with validated and improved confidence. Baseline staffing templates for day of the week within a season of the year were created and uploaded into an electronic self-scheduling application. The enhanced two-hour average forecasting tool was uploaded to the organization’s intranet for ease of use by department charge nurses. Custom reports for generating the information necessary to run the two-hour average forecasting tool were created by the department’s data analyst. Charge nurses were then trained on how to generate the report, how to transfer the data, and how to use the data for algorithmic staff resource allocation decision making. Lastly, a robust position control was created to ensure appropriate management of high-cost labor and variable FTEs.
After the first 30 days of fiscal year 2017, the average overtime hours decreased from 281 in fiscal year 2016 to 127, resulting in an average salary and wage savings of $5,715 per employee. Ten months after the application of these principles, the cost savings totaled $110,113. As demand for ED services continues to grow, appropriate allocation of resources to meet this demand will be an ongoing financial concern for management. This study provides a solution for implementing custom staffing solutions and improved resource allocation that provides a cost savings benefit.
Current healthcare technology poses a significant limitation to healthcare organizations for advancing continued growth in the use of predictive analytics. This study identified gaps related to the storage, access, and automation of EHR data and reporting. The use of real-time data and reporting would allow for enhanced modeling and the generation of automated, continuous 24-hour forecasting.
This study did not address the potential impact on quality and safety metrics such as central-line associated bloodstream infection, sepsis, and readmissions. Further, the study did not evaluate the full financial impact on the cost of staff turnover and premium pay. It is important to note that healthcare finance leaders must understand the unique environment and operations of their business if they are to effectively implement the approach described in this study in other care spaces.
Footnotes
a. Avalere Health for the American Hospital Association, Trendwatch Chartbook 2016: Trends Affecting Hospitals and Health Systems, 2016; and Hsia, R.Y., Kellermann, A.L., Shen, Y., “Factors Associated With Closures of Emergency Departments in the United States,” JAMA, May 18, 2011
b. Derlet, R., Richards, J., “Overcrowding in the Nation’s Emergency Departments: Complex Causes and Disturbing Effects,” Annals of Emergency Medicine, January 2000; Smith, B., Bouchoucha, S., Watt, E. (2016). “‘Care in a Chair’—The Impact of an Overcrowded Emergency Department on the Time to Treatment and Length of Stay of Self-Presenting Patients With Abdominal Pain
c. Mojisola, O., Scriber, R., Ducoin, D., Glasofer, A., “Designing a Data-Driven Decision Support Tool for Nurse Scheduling in the Emergency Department: A Case Study of a Southern New Jersey Emergency Department,” Journal of Emergency Nursing, January 2015.
d. Hoot, N., Zhou, C., Jones, I., Aronsky, D., “Measuring and Forecasting Emergency Department Crowding in Real Time,” Annals of Emergency Medicine, March 27, 2007. doi:10.1016/j.annemergmed.2007.01.017
e. Kulstad, E. B., Hart, K.M., & Waghchoure, S., “Occupancy Rates and Emergency Department Work Index Scores Correlate With Leaving Without Being Seen,” The Western Journal of Emergency Medicine, September 2010
f. Bhardwaj, B., “NEDOCS: A Rising Patient Throughput Measure,” Retrieved from www.spesmedici.it/docs/dal%2520mondo%2520scientifico/27%2520e%252028-10-11/NEDOCS%2520%2520(Bharat%2520Bhardwaj,%2520co founder%2520of%2520NEDOCS.org).pdf+&cd=2&hl=en&ct=clnk&gl=us
g. Skinner, J., “Forecasting Emergency Department Overcrowding,” SPNHA Review.
h. Kadri, F., Harrou, F., Chaabane, S., Tahon, C., “Time Series Modeling and Forecasting of Emergency Department Overcrowding,” Journal of Medical Systems, July 23, 2014.