


Healthcare Operations Management News
5 areas where hospitals can improve both financial performance and patient care
Published
December 2, 2019
7:39 pm
|
Updated
December 7, 2022
12:32 pm
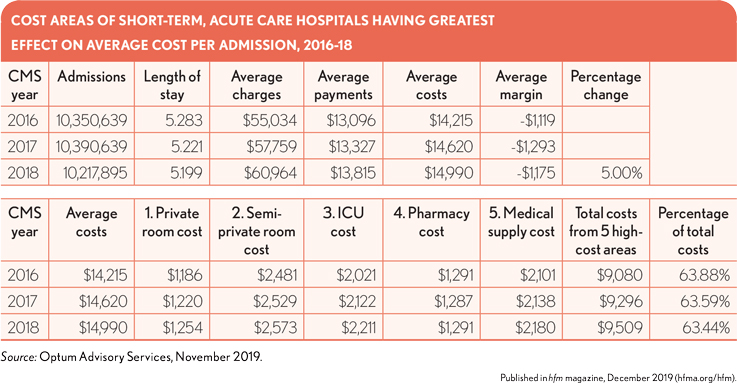
A review of data in Medicare cost reports and in CMSs Medicare Provider Analysis and Review (MedPAR) file from 2016-18, the most recent years for which data is available, shows the average loss per admission for a Medicare beneficiary at a short-term, acute care hospital increased 5% from $1,119 to $1,175. Costs increased over this period by 5.4% to $14,990, while the average payment increased to only $13,815. This increase on costs and stagnation in payments came even as the average length of stay (LOS) for each admission dropped nearly 2% to under 5.2 days.
The inclusion of charges and subsequent calculated costs at the department level allows for a deeper analysis into what areas are having the greatest impact on a hospital’s ability to realize gains or likelihood of incurring losses on an admission-by- admission level.
This deeper dive shows five hospital cost areas are responsible for more than 63% of total costs year over year. What is noteworthy is that only one of these areas (ICU costs) falls under what would be considered “medical care costs,” while the remaining areas are more ancillary, pertaining to room, pharmacy and supply costs. Room costs alone accounted for more than 25% of total costs in 2018 while pharmacy and medical supplies accounted for another 23%.
Average costs for these five areas combined increased 4.7% over 2016-18, from $9,080 to $9,509, severely affecting overall costs and lowering possible margins because payment gains are negated by the cost increases. By focusing aggressively on containing and reducing costs in these areas, hospitals could not only improve their overall financial health but also enhance the quality of care for patients by passing the cost savings on to more direct patient care areas.
Note: The MedPAR file, which CMS compiles and makes available for purchase, represents every inpatient hospital admission processed for Medicare beneficiaries in the nation and contains a number of data elements that can provide hospitals with in-depth and meaningful indicators relating to utilization, LOS, diagnosis and procedure use and assignment as well as financial performance indicators. The analysis in the exhibit on the previous page is based on the most recently released CMS fiscal year 2018 MedPAR file. A primary benefit of this data set is the inclusion of financial indicators from which charges per admission can be calculated. By mapping the MedPAR data to Hospital Cost Reports provided by hospitals to CMS, it is possible to calculate a Ratio-of-Cost-to-Charges figure that provides an accurate account of hospital costs at the admission level. The inclusion of payment and reimbursement indicators further allow for the identification of profit/loss analysis at the admission level.
This analysis was provided by Optum Advisory Services. For more information, please contact Jan Welsh.