


Costing and Managerial Accounting
Selecting the Right Costing Model
Published
October 29, 2018
9:04 am
|
Updated
February 7, 2025
3:41 pm
The absence of industry standards has led many to conclude that all cost accounting methods are equally valid. With that logic, executives may choose the method that incurs the lowest operational cost. However, a careful comparison of the outputs of popular costing models quickly demonstrates that different methods produce widely divergent results. The optimum costing method is the one that provides the proper level of outputs to support the decisions management intends to make with the cost data, recognizing that organizations differ in the demands they make on their costing systems.
Cost accounting system output can be described and evaluated across two dimensions: accuracy and detail.
Accuracy can be defined as how well the cost number produced correlates to the true cost of the item.
Detail, often referred to as granularity, refers to the number of meaningful data points the model can produce, and this dimension incorporates what in cost accounting are commonly called buckets. However, this concept goes deeper to also include the bill of material elements that populate the buckets.
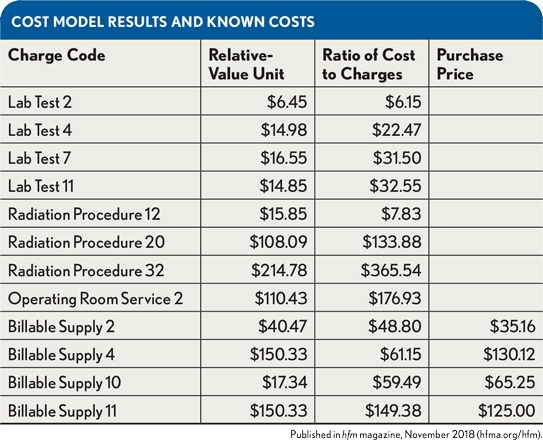
Accuracy can be understood most easily when the model results are placed next to known costs. In the exhibit below, known purchase prices are presented adjacent to costs computed using relative-value-unit (RVU) and ratio-of-cost-to-charges (RCC) models. The differences are clear. Whether those differences are significant, however, depends on what management intends to do with the numbers.
The average accuracy of each costing system can be determined by using previously established relationships shown in the exhibit below between the costing method and the “actual cost” for a sampled cross section of hospital charge codes. a Weighting the dollars within the costing system costed under each method, as shown, yields an accuracy index for the system: b
(Dollars of Cost or Revenue Under RCC × Accuracy Factor [35%]) + (Dollars of Cost or Revenue Under Single RVU × Accuracy Factor [65%]) + … = Weighted Dollars/Total Raw Dollars
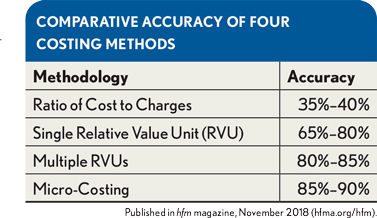
For example, $15 million costed at RCC × 35% [$5.25 million] + $30 million costed at Single RVU × 65% [$19.5 million] = $24.75 million/$45 million = 55, the accuracy index of the costing system in this example.
Accuracy scores thus derived should be depreciated to account for the time elapsed since the per-system relationships were last updated—particularly for RVU and micro-costing, because supplies and labor factors change and would not be reflected correctly in an older study. Without validation, perhaps a 5 to 10 percent reduction per year would be acceptable, allowing use of the accuracy index both to compare different costing model implementations and to engage upper management in discussions about the appropriate uses of the data—at least for decisions where cost data are used at the charge-code level.
A seminal article by Michael Shwartz, David Young, and Richard Seigrist, published in 1995, highlighted the idea that the aggregation of data often yields increased accuracy in reported results. c Thus, while the RCC estimated cost for a chest X-ray may be off by 25 percent from “true” cost, when the chest X-ray is combined with the other 200 or more items on a typical inpatient bill and summarized with thousands of other patient bills at a service line level, the overstatement errors and the understatement errors from each of the incorrectly costed procedures tend to cancel each other out and yield an accuracy increase of 10 to 15 percent. Some claim to have seen accuracy levels climb as high as the low 80s. This point demonstrates the importance of evaluating the required accuracy in the context of how management will use the data, and not simply as a standalone figure derived from looking solely at the costing data itself.
Sufficiency of Detail
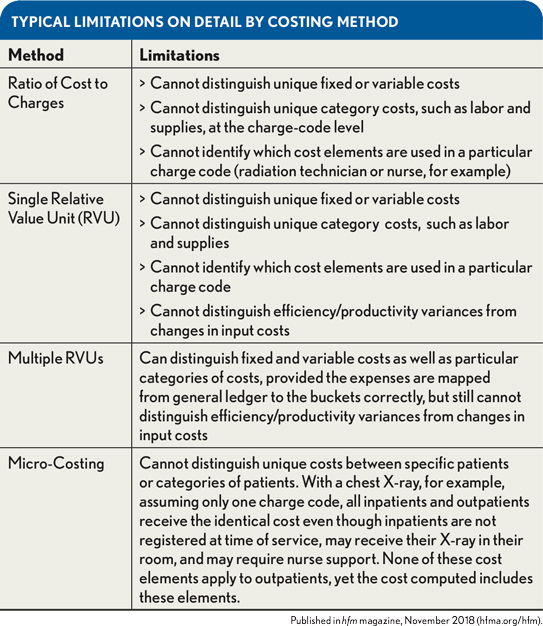
Different costing systems produce different levels of detail. For example, to determine how much hip surgery will cost next year, a simple per-procedure amount may suffice to support the rolled up total. However, if the real question is what the expense will be next year for a particular type of suture, the costing detail must indicate the relationship between each surgery and the amount of sutures consumed. By then forecasting how many surgeries of each type will be performed and combining that number with the expected purchase price of the sutures next year, the costing standards can be used to estimate the total cost of that type of suture. Clearly this type of analysis and the resultant decision require significantly more detail to be captured and reported out of the costing system than in the former example. The exhibit below summarizes typical limitations on detail by costing method.
Taken together, accuracy and detail represent the system’s precision. For every management decision, there is a minimum level of precision required to reasonably ensure management will reach a correct conclusion. Accordingly, precisionrisk can be defined as the risk that the cost accounting process will be insufficiently precise to accurately inform a management decision. This concept is analogous to audit risk, which is the risk that the auditor’s report may fail to report a material misstatement when one has occurred.
Most organizations do not have internal controls to identify when there is a risk of system failure or when an actual system failure has occurred. However, if managers expect to rely on their organization’s costing system to make important decisions, they need to be aware of the system’s limitations and when it might not be adequate to the job. This evaluation is an important element of any project involving the use of costing data and should be completed by an analyst with direction from the finance director and CFO.
One way to evaluate the effectiveness of an organization’s cost accounting system is through the precision risk framework. Much like the auditor who plans the audit procedures based on an assessment of inherent risk, control risk, and detection risk, so should the cost accountant plan and implement a cost accounting process based on an assessment of both external conditions and internal management usage intentions to arrive at the optimum precision level.
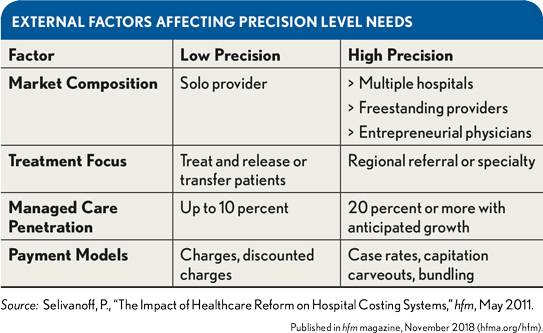
To apply the model, it is first necessary to understand the types of decisions that management desires to make with the costing data. In a general sense, the primary determinants of management’s demands on the data will be the age, education, sophistication, and culture of top leadership, but those are not the only drivers. The exhibit below shows four external factors that should lead management to demand greater precision in costing data, along with some high- and low-need aspects of each.
Working With Appropriate Precision
Managers in the low-precision environment would be expected to have significantly less need for higher precision levels than managers operating in the high-precision environments , which is why there is not a single costing method that is right for all hospitals. In considering the optimal precision for an organization, one also must anticipate what level of precision will be required in five to seven years, because some of the most powerful and often most cost-effective costing method strategies may require several years to implement and often require collaboration among multiple stakeholders. For example, redesigning job codes to permit more precise bucketing of costs may require not only human resources and payroll input, but also corporate permission.
In addition to the general operating environment factors indicated above, an entity-specific evaluation of the kinds of reports management is requesting, along with an understanding of the precision levels required to adequately support those reports, is essential to evaluating precision risk. The exhibit below provides a general guideline drawn from 20 years of experience working with costing systems in health care. It relies heavily on the previously cited work of Shwartz, Young, and Siegrist in that it restricts the use of less precise methods for reports and analyses, which traditionally incorporate lower volumes of patient records or which may incorporate a disproportionate number of charge codes from a single department or cluster of departments. The exhibit allows the user to easily evaluate different classes of reports against the capability of each costing methodology.
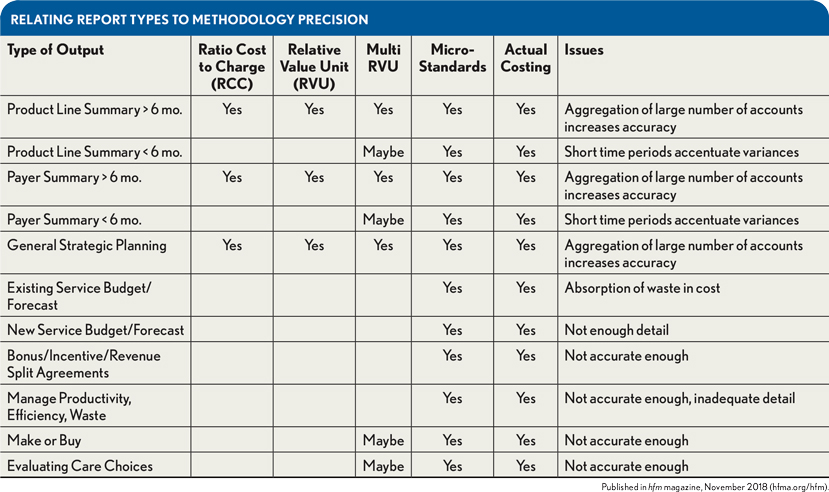
This exhibit suggests RCC would not be appropriate for analyzing the cost of outpatient radiology service, because of its narrow focus on a single charge code. Nor would it be appropriate for analyzing a single department, a short time period, or a small number of patients in a population.
In the same manner, it will be difficult to manage revenue sharing incentive arrangements using costing data that were developed under a method that lacks the precision of micro-costing. That is because these types of programs usually have as their focus a single department, a small cluster of departments, or a set of charge codes that are repeated within the reported population. The analysis often will be required for a short time frame, such as monthly or quarterly, with the result that the sample of patient data being used would be too limited. On the other hand, the exhibit suggests RCC would be an acceptable costing method for annual product-line-summary or payer-summary reports. In these cases, large volumes of cost codes are aggregated into one final number, which could be reasonably accurate.
When cost accountants find that they are increasingly producing reports that do not contain a “yes” in the methodology column that correlates to their primary costing methodology, they should give serious consideration to whether a costing system failure is occurring and what corrective action should be taken.
How to Communicate Costing System Precision Risk with Management
All reports produced by the costing department should contain an attached footnote that describes the costing method used and makes inferences about its appropriateness and, hence, the validity of the report’s conclusions. Management should be informed about the appropriateness of applying data developed by a particular method to a particular decision, and such a footnote provides an explanation of how the data were used to inform a specific decision. Such a footnote should be included for the same reason generally accepted accounting principles require that footnotes be attached to financial statements.
Dealing with Inappropriate Costing Data
A certified public accountant (CPA) is bound by professional ethics to not knowingly misrepresent facts and to obtain sufficient relevant data to afford a reasonable basis for conclusions. d Professional ethics apply to public and industry practice alike.
Costing data may be upgraded on a limited basis to meet the decision requirements, such as a physical observation of labor usage in radiology. Upgrades to the entire costing model can take months or years to plan and implement, and such effort may or may not be justified for one-off decisions.
Barring these two options, a CPA may be required to disclaim the report in a footnote.
In short, the method used to determine costs matters. The precision risk framework can be used to evaluate whether the entity’s costing system is capable of producing the level of precision required to support the reports and decisions management is making from it.
By including an evaluation of precision risk in the reporting process, and incorporating that into a footnote that explains the limitations of the costing system, managers will be less likely to make incorrect decisions due to incorrect data, and cost accounting leaders will be able to quantify more clearly the value and benefits to be derived from a greater investment in the precision of the costing data.
Paul Selivanoff, CPA, is a principal with Simply Better Outcomes, Lincoln, Neb.
Footnotes
a. Gravell, J.R., and Selivanoff, P., “Costing Method Stresses Accuracy and Cost Effectiveness,” hfm, November 1986.
b. The formula shown includes only the RCC and RVU methods, but additional methods could be included (as indicated by “+ . . .”), with the weighting percentages spread across more than two methods.
c. Shwartz, M., Young, D.M., and Siegrist, R., “The Ratio of Costs to Charges: How Good a Basis for Estimating Costs,” Inquiry, January 1995.
d. Rule 102, Rule 201, and Article II Sections 2 & 3 of the American Institute of CPAs Code of Professional Conduct.