


Standardizing denial metrics for revenue cycle benchmarking and process improvement
Healthcare providers, including hospitals, health systems and physician practices, rely on an effective and efficient revenue cycle to ensure that they receive the full payment due to their organizations from health plans and other third-party payers. Among the many hindrances to these efforts, claim denials by health plans have been increasing rapidly over the past several years. The increased number of denials and the associated loss of revenue pose stumbling blocks to financial sustainability and increase the provider’s cost to collect. Despite many new tools, documented processes, new software and emerging technology, the increased denials drain many provider resources, putting pressure on their cost structures.
The development of standard definitions and categories for claim denials creates a common language to use across providers and health plans and is critical to improvement efforts. Furthermore, without strong data to identify and support trends in claim issues, processes and solutions, unnecessary dollars will continue to be spent. Beyond adding to providers’ administrative costs on an organizational level, such expenditures contribute to administrative burden and waste for the U.S. healthcare system. Overall, healthcare administrative complexity has been estimated to be a $265.6 billion savings opportunity area.
The overarching goal of this report is to promote administrative simplification, consistency and transparency as well as increase automation, improve the patient experience and enhance yield performance by creating and defining claim resolution standards and metrics for measurement and benchmarking. This broad goal includes:
- Creating tools to help delineate the scope of the denials management issue
- Building awareness of the denials management issue and associated costs to the healthcare industry
- Promoting collaboration among providers, clinicians and health plans to work toward solutions
- Helping to reduce the infrastructure required to manage denials and improve claim integrity
- This work will be ongoing and will evolve as regulations and environmental factors change.
When HFMA established the Claim Integrity Task Force, it charged the group with identifying a process for measuring outcomes of denials management efforts, going beyond standard revenue cycle metrics, which include HFMA’s MAP Key Performance Indicators (KPIs). Information about how the claim integrity KPIs were developed is provided in appendix 1. The principal outcome of the task force’s efforts are the metrics described in this report:
- Initial Denial Rate (as a percentage of volume and dollars)
- Primary Denial Rate
- Denial Write-Offs as a Percentage of Net Patient Service Revenue (HFMA MAP Key AR-6)
- Time from Initial Denial to Appeal
- Time from Initial Denial to Claim Resolution
- Percentage of Initial Denials Overturned (with reference to charges, volume and inpatient denials that converted to observation)
Sponsored by


Denials management in a patient-centric revenue cycle
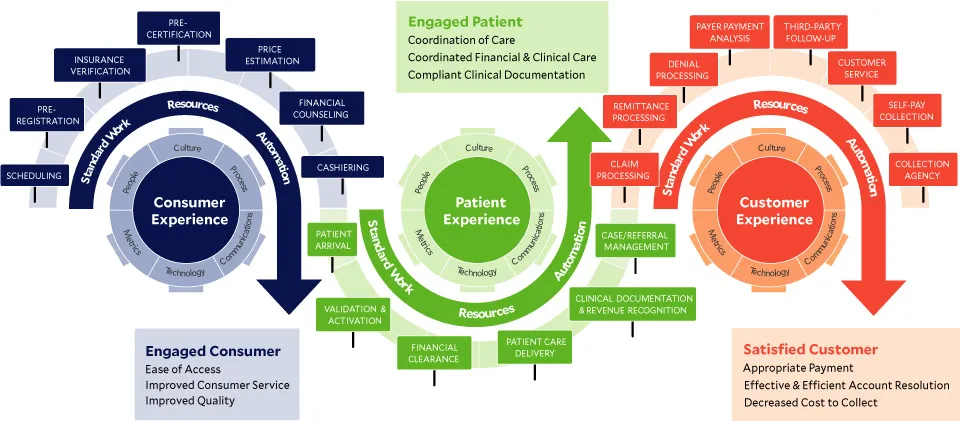
The HFMA Patient-Centric Revenue Cycle Roadmap illustrates the complexity and the action points in the healthcare revenue cycle. A growing problem for healthcare organizations is a denial. A denied claim is one that is received and processed by the health insurance plan and a negative determination is made. This causes delays in payments, lost revenue and decreased patient satisfaction. There are many areas along the revenue cycle roadmap that prevent or create denials, which is why it is so important to understand where to target efforts for performance improvement and waste reduction.
The increasingly challenging financial reality of healthcare only adds to the need for an efficient and effective revenue cycle operation. From scheduling patient appointments through resolution of a claim denial, there must be attention to detail and data integrity to avoid rework and denials, which only add to the already mounting pressure on revenue cycle performance. Addressing the primary risks and causes of denials requires data and metrics to identify opportunities and challenges. In response, HFMA members have developed a practical set of tools to support financial sustainability and an increased positive consumer and patient experience for all healthcare organizations.
The patient-centric revenue cycle roadmap
Key performance indicators for claim integrity
Initial denials as a percentage of volume and charges – Claim Level
Purpose. Trending indicator of total population of initial denials at the claim level. The KPIs introduced in this report provide the foundation for standardization and benchmarking. The task force also recognizes that the best practice for reporting and analyzing the initial denials metric would be at the claim line level. This next level of detail is defined in appendix 2.
Value. Provides overall trend on rates of occurrence for both volume and dollars, highlighting potential process, system or data issues.
Notes
- For both KPIs, “denial claims” is defined to include only the first denial that was made for a given claim. If there are multiple denials on one claim, the first chronological denial is selected for this report. If there are multiple denials on one claim with the same denial date, only one denial will be arbitrarily selected as the initial denial.
- UB04: Excludes bill type “XX7” (all rebills); 1500: Excludes any claim with “R” in Box 22 and all other rebills.
- For dollars use total charges.
Formulas
| Initial denial rate as a percentage of claim volume | = | Total initial denial claims ÷ Total claims submitted* |
| Initial denial rate as a percentage of claim dollars | = | Total initial denial claims gross charges ÷ Total claims submitted gross charges |
*Average of the 3-month period prior to the start of the reporting month
Primary denials
Purpose. Trending indicator of denials related specifically to patient’s primary health plan[s].
Value. Provides a specific, detailed rate of denials for primary claims highlighting potential process, system or data issues.
Formulas
Total number of zero remits posted in past 4 weeks
÷
Total number of remits* for primary payers only** in past 4 weeks
*Payments and zero paid
**Excluding duplicates
Denial write-offs as a percentage of net patient service revenue
Purpose. Trending indicator of final disposition of lost reimbursement where all efforts of appeal have been exhausted or provider chooses to write off expected payment amount.
Value. Indicates provider’s ability to comply with payer requirements and payer’s ability to accurately pay the claim.
Notes. For “net dollars written off as denials,” use total dollars written off as a denial in the reporting month, net of recoveries.
Formulas
| Net dollars written off as denials ÷ Average monthly net patient service revenue | X | Patient financial system income statement |
Time from initial denial to appeal
Purpose. Measure timeliness of denial appeal process.
Value. Understand internal process efficiency for trending and comparison.
Formulas
Count the number of days from date of initial
denial remittance until appeal submission date.
Time from initial denial to claim resolution
Purpose. Measure timeliness of claim resolution process.
Value. Understand internal process efficiency for trending, comparison and health plan compliance with contracted appeal turnaround time(s).
Formulas
Count the number of days from date of initial
denial remittance until claim resolution.*
*Zero balance with or without payment
Percentage of initial denials overturned
Purpose. Performance and trending indicator of denial appeal success.
Value. Understand denial appeal efficiency and effectiveness as well as potential issues with specific plans or types of denials (i.e., inpatient overturned and converted to observation).
Note. Numerator and denominator should be calculated for the same period to ensure appropriate output.
Formulas
| Gross charges | Initial denials overturned and paid (gross charges for overturned and paid claims) ÷ Total initial denial dollars paid and adjusted (gross charges) | |
| Claim volume | Initial denials overturned and paid (claim volume) ÷ Total initial denials paid and adjusted (claim volume) | |
| Converted to Observation | Total inpatient denials overturned and paid converted to observation ÷ Total inpatient denials overturned, paid and adjusted |
Summary
These KPIs provide a foundation for consistent measurement and reporting of claim integrity process and performance. Healthcare needs a fundamental change in approach to claim integrity. These tools represent a first step toward a solution for the industrywide problem of denials. The real work lies in analyzing, collaborating and improving performance across the healthcare industry. Such ongoing work will help reduce administrative complexity in healthcare, thereby reducing unnecessary expenditures at the macro level.
Appendix 1: How the claim integrity KPIs were developed
The task force began its work by scoping the core issue that needed to be addressed. This was determined to be all post-discharge submitted claim denial management issues. Within the revenue cycle process, there are many critical points related to denials, but it is necessary to identify and define the type to ensure the measurement can be standardized and completed. While not entirely comprehensive, this puts a clear boundary around the type of claims and corresponding denials included for measurement.
Once the core issue was established, the group considered how to approach categorizing the different types of denials. Several initial categories were identified, including medical necessity and level of care, eligibility, authorization and notifications. These categories, though helpful, represent a level of detail that may be challenging to standardize, making it less valuable for benchmarking. The information is still valuable from a denials management perspective, however, as it represents an agreed-upon structure for approaching denials internally. As a result, we have included these as a recommended categorization for denials management.
The next step was to define the components of this short list of key process or performance measures and develop the calculation for a meaningful metric. As a result, the task force pivoted toward measurement and how to approach it at a higher level of detail. This included considering broad, comparable metrics that many of their organizations currently use for revenue cycle management today.
As a starting point, the task force began with the two industry standard HFMA MAP KPIs related to denials: “MAP Key AR-5: Remittance Denial Rate” and “MAP Key AR-6: Denial Write-Offs as a Percentage of Net Patient Service Revenue.” These are both trending indicators, and the task force delved into them and other potential measures to provide the industry with advance metrics for improving claim integrity.
Beyond the MAP Keys, the task force reviewed dozens of additional data and metrics. Due to nuances and specific situations at different providers in different markets, however, not all were valuable or comparable. Many of the existing metrics used by the task force members were shared to provide a foundation for the creation and development of standard KPIs. This information was consolidated and reviewed by task force members and their teams. The task force then evaluated the metrics as a group. After an intensive vetting process, the metrics presented in this report were identified.
Once these metrics were determined to be the true KPIs that could be easily defined, captured, measured and compared across all types of provider organizations, the task force created standard definitions for each. Considering the various systems and capabilities within healthcare provider revenue cycle operations, much thought and consideration went into keeping these metrics simple, yet meaningful.
These KPIs provide a much-needed measurement structure to begin standardizing the performance of providers and support the identification of best practices as well as solutions to improvement.
Example denial categories
Medical necessity and level of care
Inpatient/Outpatient> Observation versus inpatient
Denied days
Insufficient clinicals
DRG downgrade
Criteria interpretation/application
Eligibility
Coordination of benefits
- 271 payer source issues
- Patient responsibility information-covered/noncovered
Eligibility Information
- Standard insurance “card” information
- Key fields
- Barcodes
- Electronic file format
- Product type for categorization
Authorization
Defining when/if needed
Confirmation of authorization
- Better defined explanation of what is authorized/approved
Inpatient authorizations
Outpatient authorization
Referrals
Diagnosis code & CPT changes
Timeliness
Notifications
278 standardization
Network updates
Appendix 2: Initial denials as a percentage of charges and volume – line level
The KPIs introduced in this report provide the foundation for standardization and benchmarking. The task force also recognizes that the best practice for reporting and analyzing the initial denials metric would be at the claim line level. This next level of detail is defined below.
| Initial denial rate as a percentage of claim dollars | = | Total initial denial claims gross charges at line level ÷ Total claim lines submitted gross charges* |
*Average of the 3-month period prior to the start of the reporting month
Notes. “Total initial denial claims gross charges at line level” includes all initial denials, based on claims adjustment reason code, on a given claim. If there are multiple denials on one claim, each CPT with the same denial date would be included, as they should all be included for reporting and tracking.
The charge amount posted/recorded for the line-item denials should be the charge for the line item, not the full claim duplicated times each denied CPT code.
| Initial denial rate as a percentage of claim dollars | = | Total initial denial claims gross charges at line level ÷ Total claim lines submitted gross charges* |
*Average of the 3-month period prior to the start of the reporting month
Notes. Includes all initial denials, based on claim adjustment reason codes, on a given claim. If there are multiple denials on one claim, each CPT would be included, with the same denial date; they should all be included for reporting and tracking.